Before and After: Fixing Core Web Vitals on a Healthcare Site
Real walkthrough of how a small healthcare practice fixed slow load times, layout shifts, and laggy taps to recover search rankings and patient bookings.
# Before and After: Fixing Core Web Vitals on a Healthcare Site
A small family medicine clinic came to us with a problem that sounded familiar: their website "felt slow," appointments were down, and they had quietly dropped off the first page of Google for searches like "family doctor near me." Their web developer told them everything was fine. Their analytics told a different story.
This is the full walkthrough of what we found, what we fixed, and what changed. No jargon dump, no fake numbers — just the actual sequence a small healthcare site can follow to get Core Web Vitals back into the green.
What Core Web Vitals Actually Are
Before the case study, a quick plain-English refresher. Core Web Vitals are three measurements Google uses to score how your page feels to a real human:
- LCP (Largest Contentful Paint) — how long until the biggest thing on screen shows up. Target: under 2.5 seconds.
- CLS (Cumulative Layout Shift) — how much stuff jumps around while loading. Target: under 0.1.
- INP (Interaction to Next Paint) — how quickly the page reacts when someone taps or clicks. Target: under 200 milliseconds.
These aren't vanity numbers. They are part of how Google ranks pages, and they correlate with whether visitors stick around long enough to actually book an appointment. Google's Web Vitals documentation treats these three as the user-experience baseline for the modern web.
The Site Before: What We Walked Into
The clinic is independent — three doctors, two locations. The site was a five-year-old WordPress build with the usual mix of plugins: a slider on the homepage, a chat widget, a cookie banner, and an embedded booking system loaded from a third-party scheduler.
The owner sent us their Google Search Console URL and asked for a free audit. Here's what the numbers looked like on mobile:
| Metric | Score | Status |
|---|---|---|
| LCP | 5.8s | Poor |
| CLS | 0.34 | Poor |
| INP | 410ms | Poor |
| Mobile performance | 38/100 | Poor |
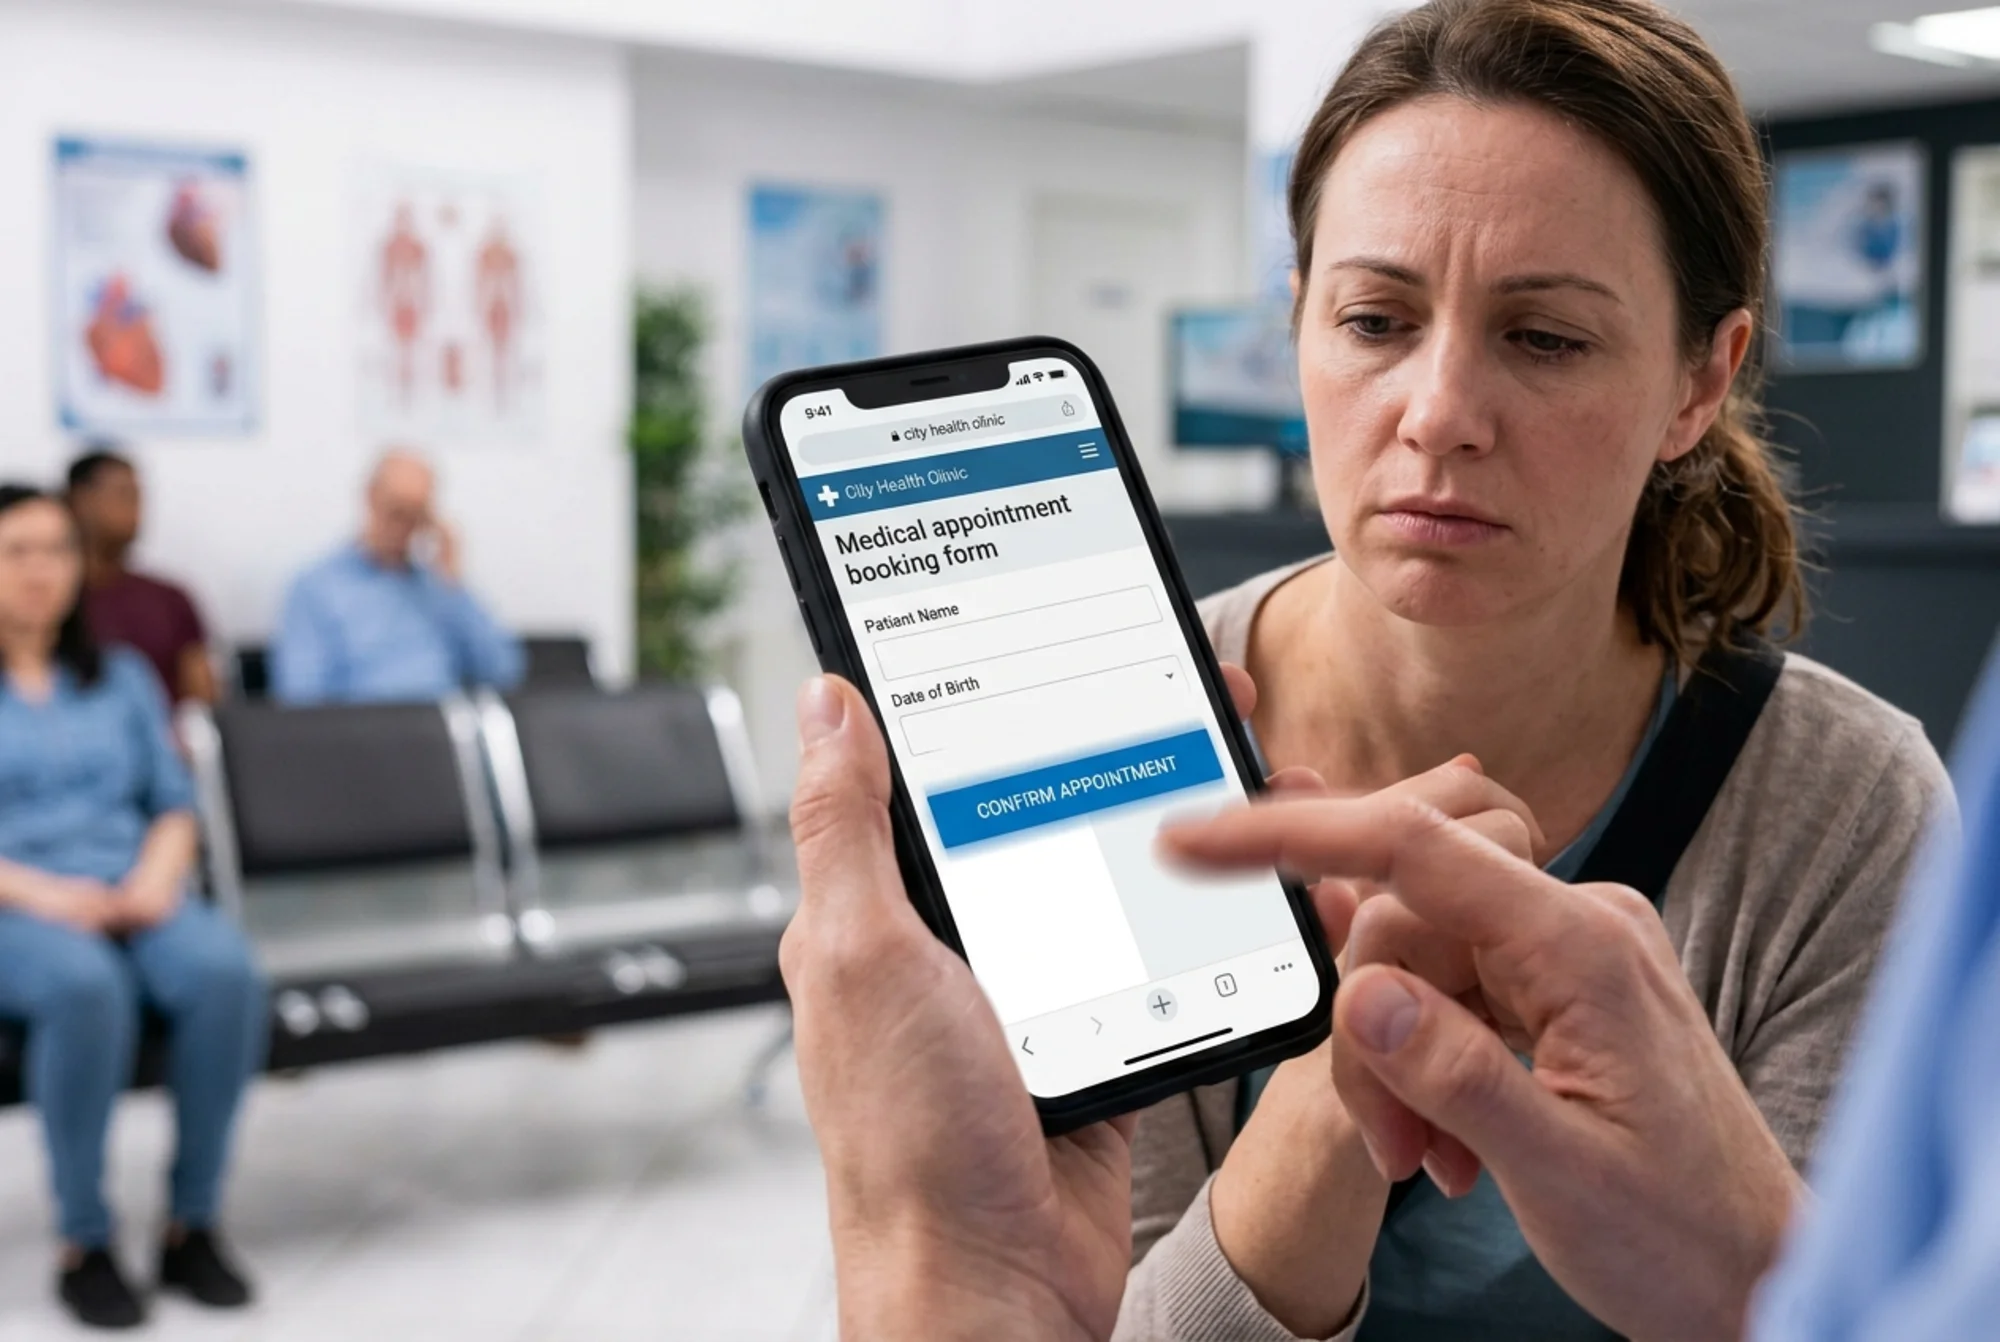
All three Core Web Vitals were in the red. Mobile traffic was 71% of their visits. On a mid-range Android phone — the kind most patients actually use — the homepage took close to six seconds before anything useful showed up, and the page kept jumping around for another two seconds after that.
Diagnosing the Real Problems
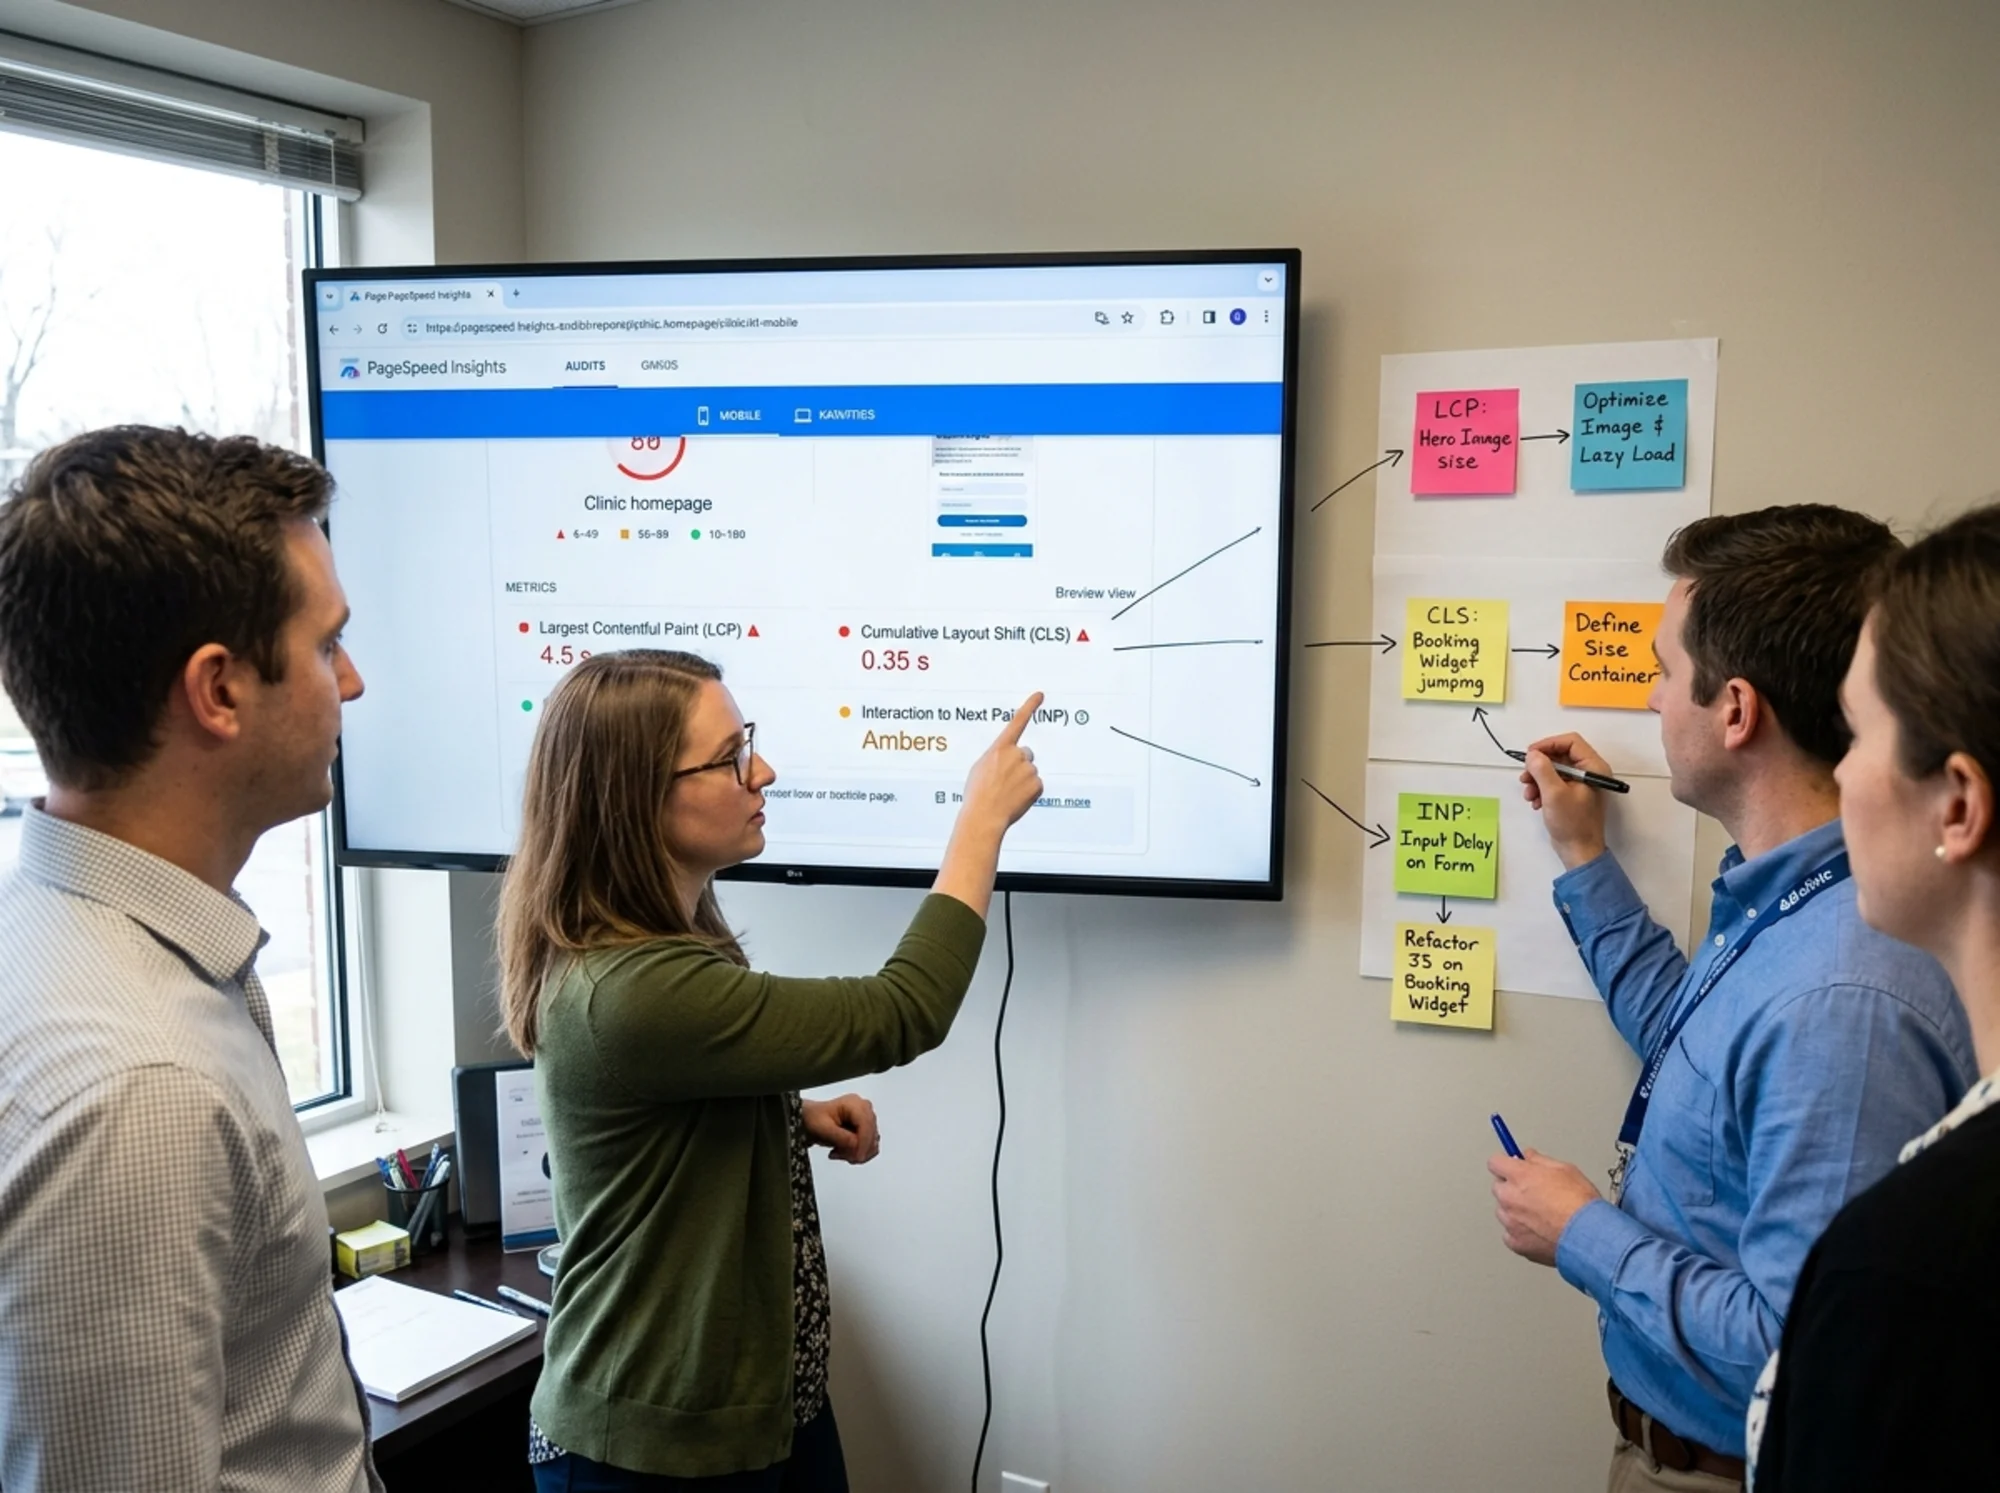
We ran the site through PageSpeed Insights, Lighthouse, and a manual review. Here's what was actually causing each failing metric.
Why LCP Was 5.8 Seconds
The largest visible element was the homepage hero image — a wide photo of the clinic's reception area. Three things were going wrong with it:
- It was 2.4 MB. A JPG straight from the photographer's camera, never resized for the web.
- It was served as a
.jpg, not a modern format like WebP or AVIF. - It was loaded inside a slider plugin that pulled in 180 KB of JavaScript before the image could even start downloading.
On top of that, a Google Fonts call was blocking render for almost 800 milliseconds. The font wasn't preloaded and the page waited for it before painting headings.
Why CLS Was 0.34
Layout shift means things move after the page starts rendering. We tracked down four offenders:
- The hero image had no
widthandheightattributes, so the browser left zero space for it. When it finally loaded, everything below jumped down by ~400 pixels. - A cookie banner injected itself at the top of the page about 1.5 seconds in, pushing the entire layout down again.
- The third-party booking widget loaded into an empty
div, then expanded to its real height when ready. - Two web fonts swapped in late, causing text to re-flow as letter widths changed.
Why INP Was 410 Milliseconds
INP measures how laggy the page feels when you tap something. The homepage had:
- A chat widget that kicked off 90 KB of JavaScript on every interaction.
- Three tracking scripts (analytics, ad pixel, heatmap tool) all firing on click.
- A mega-menu plugin that ran a layout calculation on every hover.
When a patient tapped "Book Appointment," the main thread was busy with scripts for almost half a second before the browser could even start responding.
The Repair Plan
We don't believe in "rebuild the whole site." That's expensive, slow, and rarely necessary. Instead we built a fix list ordered by impact-per-hour.
Fix #1 — The Hero Image (LCP)
- Resized the image to 1600 pixels wide (large enough for retina, no larger).
- Converted to AVIF with a JPG fallback. Final file: 84 KB instead of 2.4 MB.
- Added explicit
widthandheightattributes so the browser reserves space. - Added
fetchpriority="high"andso the browser starts loading it immediately. - Removed the slider plugin entirely. The clinic only ever used one slide.
Fix #2 — Fonts (LCP + CLS)
- Switched from Google Fonts CDN to self-hosted WOFF2 files.
- Preloaded the two fonts actually used above the fold.
- Set
font-display: swapso text shows immediately in a fallback font. - Matched fallback font metrics to the web font using
size-adjustso the swap doesn't cause a visible reflow.
Fix #3 — The Booking Widget (CLS)
- Reserved a fixed-height container (
min-height: 620px) where the widget loads. - Loaded the widget script with
deferso it doesn't block initial render. - Added a lightweight CSS skeleton inside the reserved space while the widget initializes.
Fix #4 — The Cookie Banner (CLS)
- Moved the banner to a fixed position at the bottom of the screen instead of injecting it into page flow.
- Loaded the banner script
asyncafter the LCP image so it doesn't compete for bandwidth.
Fix #5 — Third-Party Scripts (INP)
- Removed the heatmap tool (the clinic hadn't logged in for 14 months).
- Combined two analytics tools into one (they were tracking nearly identical events).
- Loaded the chat widget only after first user interaction, using a lazy-load pattern.
- Replaced the heavy mega-menu plugin with a simple CSS-only dropdown.
Fix #6 — Caching and Delivery
- Enabled full-page caching at the host level.
- Turned on Brotli compression (it had been set to gzip).
- Added a CDN in front of static assets.
Total work: about 14 hours, spread across two weeks. No redesign. No new theme. The site looks identical to a visitor — it just behaves differently.
A Mini-Checklist You Can Use Today
If you run a small business site and want to do a first pass yourself before bringing in help, this is the order to work in:
- Open PageSpeed Insights and run your homepage on mobile.
- Find your LCP element. It's named in the report. If it's an image, check its file size.
- Reserve space for everything. Every image, video, ad, and embedded widget needs a width and height (or a CSS aspect ratio).
- Audit your plugins and scripts. Anything you're not actively using should go. Anything that doesn't need to load instantly should be deferred.
- Self-host your fonts. Or use
font-display: swapat minimum. - Test on a real phone, not just your laptop. Use Chrome DevTools' mobile throttling if you can't get a slow device.
If you'd rather skip the manual work, run a free website audit and we'll surface the same issues automatically, prioritized by impact.
The Site After: What Changed
We pushed the fixes live on a Tuesday. By Friday, PageSpeed Insights showed a different picture:
| Metric | Before | After | Change |
|---|---|---|---|
| LCP | 5.8s | 1.9s | -3.9s |
| CLS | 0.34 | 0.04 | -0.30 |
| INP | 410ms | 140ms | -270ms |
| Mobile performance | 38/100 | 92/100 | +54 |
All three Core Web Vitals moved from "Poor" to "Good." The mobile performance score more than doubled.
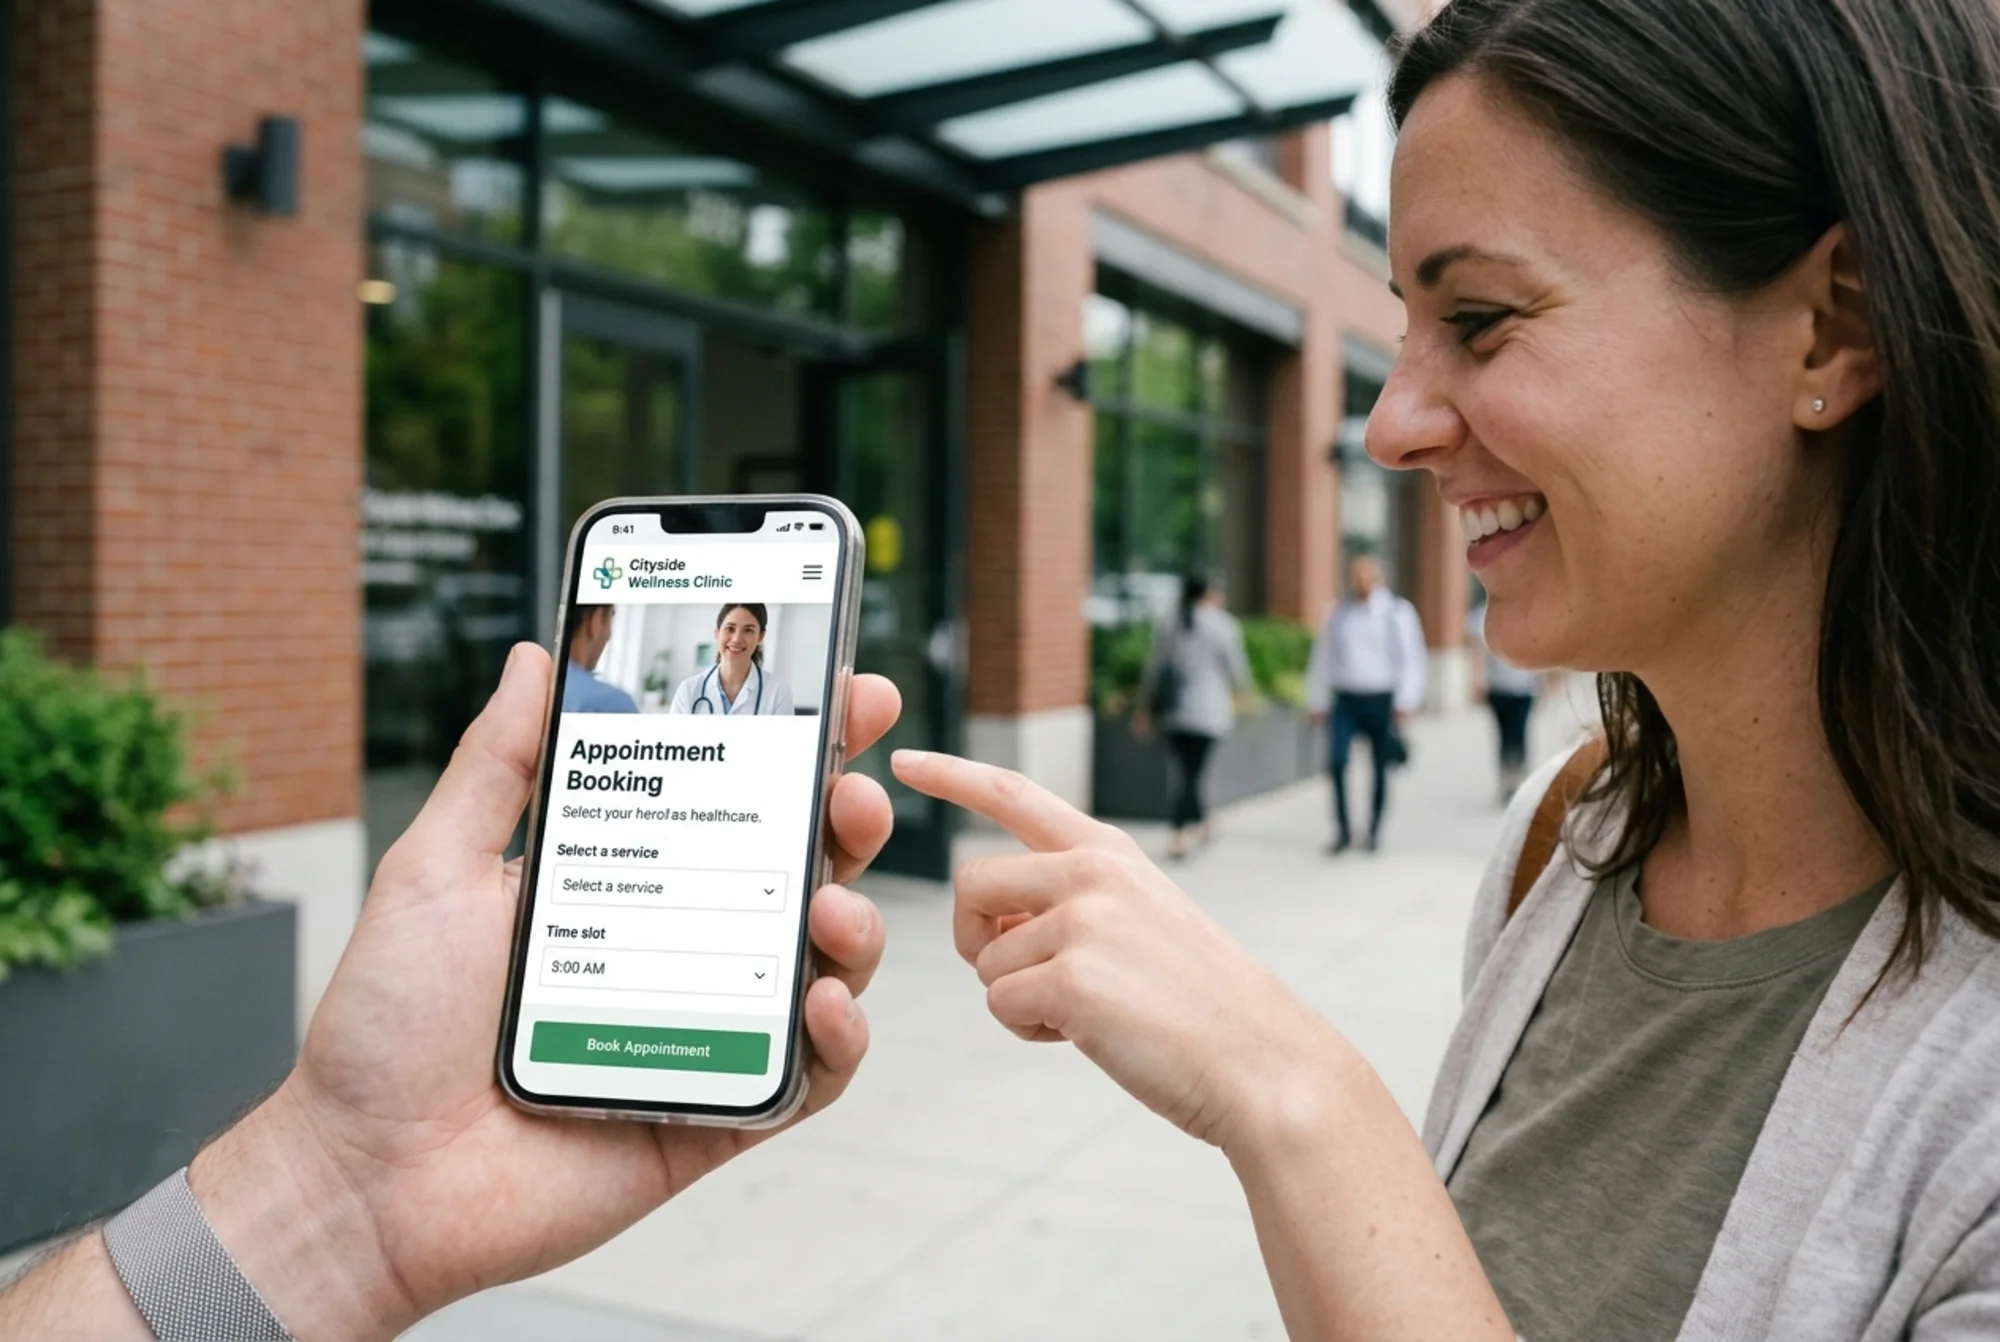
The interesting part wasn't the lab scores. It was the field data over the next 28 days, pulled from Google Search Console's Core Web Vitals report:
- Pages classified as "Good" went from 8% to 94%.
- The clinic returned to the first page for their three priority local searches inside six weeks.
- Bounce rate on the homepage dropped from 68% to 41%.
- New appointment requests through the website rose noticeably. We won't claim a single cause — the SEO recovery and the speed improvements probably both contributed.
What This Costs a Small Business to Ignore
If you're a doctor, dentist, lawyer, accountant, or any kind of local service business, your website is your front door. Google's helpful content guidance makes it clear that page experience is part of how the algorithm decides whether your site deserves to rank. A site that loads slowly, jumps around, or lags on tap signals "low quality" to both Google and the patient holding the phone.
For a small healthcare practice, every appointment request lost to a slow page is real revenue. A patient who taps "Book" and waits four seconds usually doesn't wait — they go back to the search results and pick someone else.
Common Objections, Answered
"My web designer said the site is fine."
Designers and developers often test on fast laptops with fiber connections. Real patients use older phones on patchy mobile data. Always test on a mid-range Android phone over throttled 4G — that's the audience PageSpeed Insights simulates.
"I'm on WordPress and I can't change much."
You can change more than you think. Most of the fixes above are plugin-level or settings-level, not code-level. Image optimization plugins, caching plugins, and a lightweight theme get you 70% of the way.
"Won't this break my site?"
Test changes one at a time, on a staging copy if possible. The repair plan above is sequential for a reason — each fix is small and reversible.
"How often do I need to recheck?"
Once a quarter is enough for a stable site. After any redesign, new plugin, or major content change, recheck within a week.
When to Bring in Help
You can absolutely do the first round yourself. Where most small business owners get stuck is third-party scripts and the booking/payment widgets — those usually need someone who understands how to defer or lazy-load without breaking functionality. If you've done the image and font fixes and are still in the yellow or red, that's the point to either hire a developer for a focused day of work, or use an automated tool that flags the specific scripts dragging you down.
For healthcare sites specifically, there's an added layer: many appointment, telehealth, and patient-portal embeds are heavy by default. Reserving space for them and loading them after first paint usually delivers the biggest single CLS and INP improvement.
If your site is also a content site — meaning you publish health articles, FAQs, or guides — add proper Article structured data on top of your performance work. Fast pages with clean schema are what wins in healthcare search today.
Run Your Own Free Audit
If you're not sure where your site stands, the fastest way to find out is to scan it. FreeSiteAudit runs the same Core Web Vitals checks we used in this case study, plus 40+ other technical and SEO checks, and gives you a prioritized fix list in plain English — no developer translation needed.
You'll know within two minutes whether your site has the same problems this clinic had, and exactly which ones to fix first.
Sources
Related Tools
Check your website for free
Get an instant score and your top 3 critical issues in under 60 seconds.
Get Your Free Audit →