Core Web Vitals Audit: A Step-by-Step Walkthrough for Small Business Sites
A plain-English, step-by-step Core Web Vitals audit for non-technical site owners — what LCP, INP, and CLS mean, how to read them, and what to fix first.
# Core Web Vitals Audit: A Step-by-Step Walkthrough for Small Business Sites
If you run a small business website, you have been told that Core Web Vitals matter for Google rankings and for keeping visitors on your page. What is usually missing is a clear, no-jargon walkthrough of how to actually audit your own site, read the numbers, and know what to fix first.
This guide is that walkthrough. You do not need to be a developer. You need about 30 minutes, a browser, and your site's URL.

What Core Web Vitals Actually Are
Core Web Vitals are three measurements Google uses to describe how a real visitor experiences your page. They are not opinions or design grades — they are timings and movements recorded while the page loads and while someone uses it.
- LCP (Largest Contentful Paint) — How long until the biggest visible thing on the page (usually a hero image, banner, or headline) finishes loading. Target: under 2.5 seconds.
- INP (Interaction to Next Paint) — How long the page takes to visually respond after a tap or click. Target: under 200 milliseconds.
- CLS (Cumulative Layout Shift) — How much the page jumps around while it loads. Target: under 0.1.
If your homepage shows its main image in two seconds, responds to a tap in 150 milliseconds, and does not shove buttons around as it loads, you pass. If not, you have specific things to fix.
A note on INP: it replaced the older FID metric in March 2024. Older guides that mention "First Input Delay" are talking about a retired measurement.
Why This Matters for a Small Business
Three reasons, in order of how immediately you feel them:
- Visitors leave slow sites. Mobile users especially. A few seconds of delay is enough for many to bounce back to search results.
- Lagging buttons lose conversions. A buyer who taps "Add to Cart" and sees nothing happen for half a second often taps again, gets confused, or gives up.
- Google uses these signals. Core Web Vitals are part of Google's page experience signals. They will not overcome bad content, but between similar pages they help.
You do not need perfect scores. You need to be in the "Good" range on the metrics that affect your highest-traffic pages.
Step 1: Pick the Right Pages to Audit
Do not start with every page. Start with the three or four that actually drive your business:
- Your homepage
- Your most-visited product, service, or landing page
- Your highest-converting page (often pricing, contact, or a booking form)
- One blog post or article that ranks well in search
That is your audit set. Fixing these has more impact than tinkering with pages no one visits.
Step 2: Run the Field Data Check
Open PageSpeed Insights. Paste in your first URL. Hit Analyze.
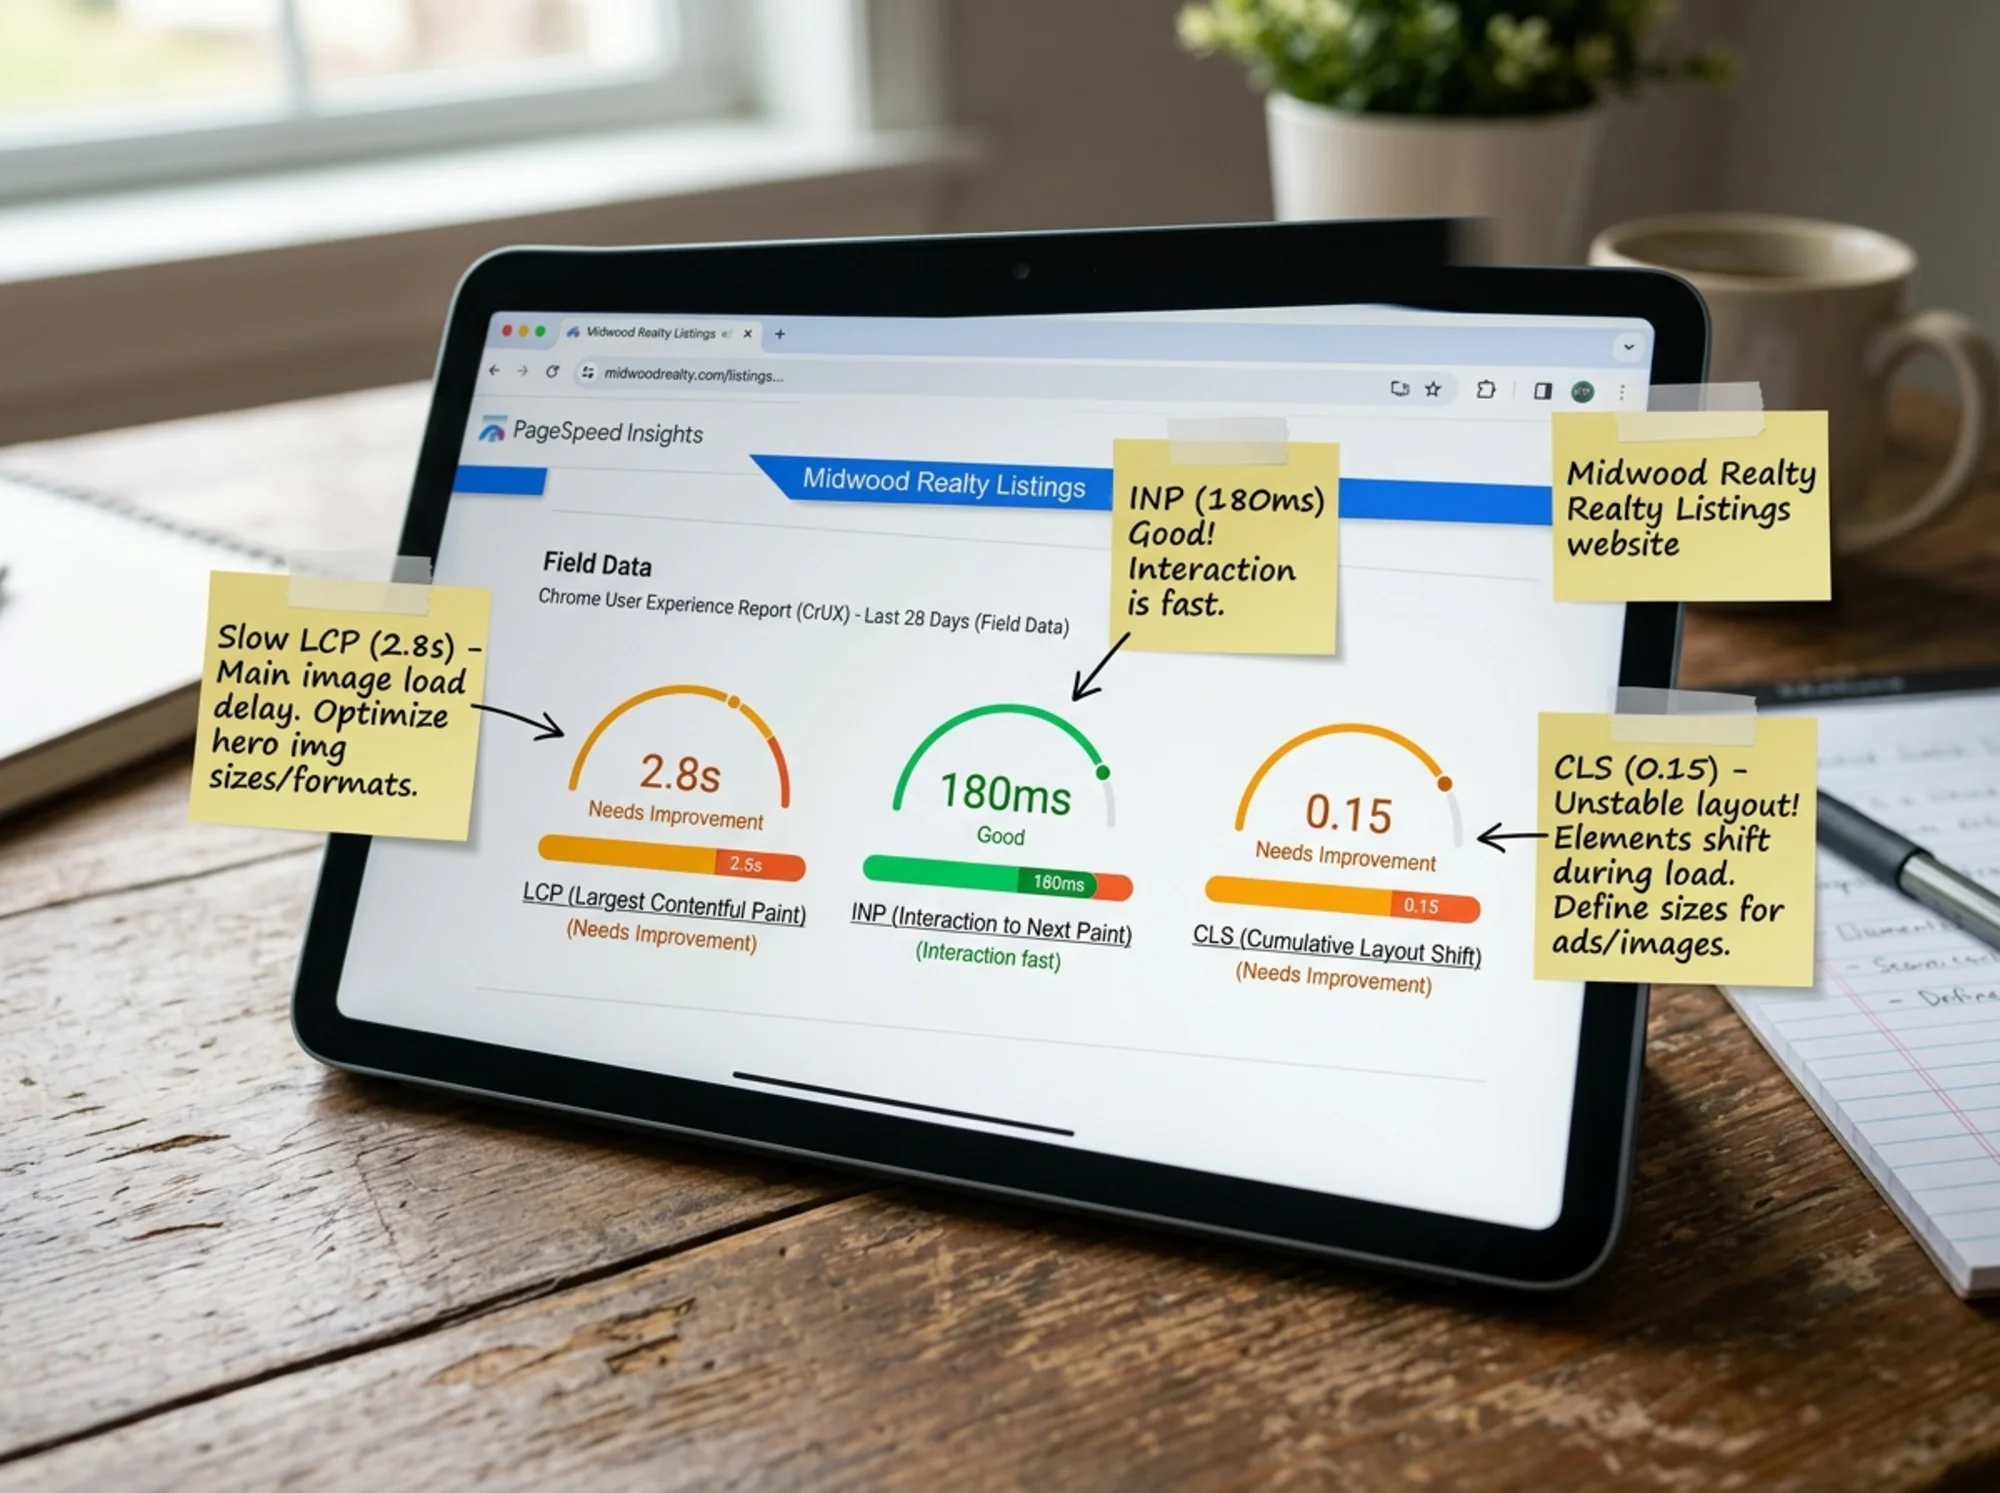
Scroll past the score gauge at the top. You are looking for the section labeled "Discover what your real users are experiencing." This is your field data, drawn from the Chrome User Experience Report (CrUX). It reflects how real Chrome visitors experienced your page over the last 28 days — and it is the data Google actually uses.
You will see four bars: LCP, INP, CLS, and FCP (First Contentful Paint — useful context, not a Core Web Vital). Each is color-coded:
- Green — Good
- Orange — Needs Improvement
- Red — Poor
Write down the result for each. If the field data section says "not enough data," your site has low traffic and you will have to rely on the lab test below — fine, just less authoritative.

Step 3: Read the Lab Diagnostics
Below the field data, PageSpeed Insights shows a lab test — a simulation it just ran on your URL. This gives you actionable items even when field data is thin.
Look at two sections:
Diagnostics — what is slowing the page down. Common entries:
- "Largest Contentful Paint element" — names the exact image or text block that is your LCP
- "Avoid large layout shifts" — lists the elements that move during load
- "Reduce unused JavaScript" — usually a plugin or third-party tag is heavy
Opportunities — suggested fixes with estimated savings. Anything offering more than 0.5 seconds is worth attention. Anything under 100 milliseconds is usually not.
Step 4: Check Mobile Separately
At the top of PageSpeed Insights, toggle between Mobile and Desktop. Always start with mobile. Most small business traffic is mobile, mobile networks are slower, and Google ranks based on the mobile version of your page.
Desktop scores almost always look better. A site that is green on desktop and red on mobile still has a problem.
Step 5: Run the Same Check on Three or Four Pages
Repeat steps 2 through 4 for each page in your audit set. Keep notes in a simple table:
| Page | LCP | INP | CLS | Biggest Issue |
|---|---|---|---|---|
| Home | 3.2s | 180ms | 0.05 | Hero image |
| Pricing | 2.1s | 220ms | 0.02 | Slow button response |
| Blog post | 4.5s | 140ms | 0.18 | Ad inserting late |
You will almost always see a pattern — one or two issues that show up everywhere. That is what you fix first.
A Specific Walkthrough: A Local Florist's Homepage
Here is a realistic case. A florist has a homepage with a wide photo of arrangements at the top, a "Shop Bouquets" button, and a chat widget that loads after a second.
She runs PageSpeed Insights on mobile and sees:
- LCP: 3.8 seconds (Poor)
- INP: 120ms (Good)
- CLS: 0.22 (Poor)
Two problems, one good metric. She opens the diagnostics.
For LCP, the report names the hero image as the LCP element. It is 2.1 MB, served at full resolution even on a phone. The fix: resize it (1600px wide is plenty) and save it in a modern format like WebP. After updating the image through her site builder, the file drops to 180 KB and LCP comes down to 1.9 seconds.
For CLS, the diagnostic flags her chat widget. It appears one second after page load and pushes everything down. The fix: switch the widget to a "fixed bubble" position in the bottom right, where it cannot push content. CLS drops to 0.04.
Total time invested: about 40 minutes. Both metrics now in the green. No developer required.
Common Causes by Metric (and What Usually Fixes Them)
LCP problems are almost always images
- Is your hero image larger than 200 KB? Resize and compress it.
- Is it served as JPEG or PNG instead of WebP or AVIF? Convert it.
- Is it being lazy-loaded? The hero image should not be lazy-loaded — it must load immediately.
- Is it delivered from a CDN? Shopify, Squarespace, Webflow, and modern WordPress hosts usually handle this automatically. Bargain shared hosting often does not.
More: LCP fixes.
INP problems are usually third-party scripts
- How many tracking scripts run on your page? Analytics, ad pixels, heatmaps, chat widgets — every one adds work for the browser.
- Are you running multiple page-builder or animation plugins? They compete for the main thread.
- Does the slow interaction involve a form, dropdown, or filter? That control may be running heavy JavaScript on every change.
The fastest INP wins come from removing scripts you no longer use. Open your tag manager and your plugin list. If a tag has not been audited in the last six months, ask whether it is still earning its keep.
More: INP fixes.
CLS problems are usually missing image dimensions or late-loading content
- Do your images have width and height attributes set? Most modern builders handle this, but custom-embedded images often do not.
- Do ads, banners, or popups appear after load? Reserve fixed space for them or position them where they cannot push content down.
- Do you use a cookie banner that pushes the page when it appears? Switch it to an overlay.
- Does a web font swap in late and reflow text? Set
font-display: optionalor preload the font.
More: CLS fixes.
Step 6: Re-Test After Each Change
The step most people skip. After you change one thing, run PageSpeed Insights again on the same page. The lab score updates immediately. Field data takes 28 days because it depends on accumulated real-user reports.
Do not change five things at once. You will not know which one helped, and if something gets worse you will not know what caused it. Change, test, document, move on.
Step 7: Set a Re-Audit Cadence
Core Web Vitals drift. A new plugin, a redesigned hero, an extra tracking pixel, a slow third-party embed — any of these can push a green score into orange in a week.
A reasonable cadence:
- Monthly: Quick PageSpeed check on your top three pages.
- Quarterly: Full audit across your audit set.
- After any major change: Test before and after launching a redesign, a new product page, or a campaign with extra tracking.
If that is too much to remember, automate it. Tools that alert you when a metric crosses the "Poor" threshold save you from finding out during a sales push.

What "Good Enough" Looks Like
You are not chasing 100. You are chasing all three metrics in the green band. A site that scores 78 in the PageSpeed gauge with green field data is in better shape than one that scores 95 in the lab with red field data — real users are what Google ranks on.
Target: LCP under 2.5s, INP under 200ms, CLS under 0.1 on mobile, on your top pages. Hit that and you are ahead of most of your competitors.
What Most Small Businesses Get Wrong
A few patterns we see all the time:
- Obsessing over the homepage while a high-traffic product page sits in the red.
- Chasing the lab score instead of field data, which is what Google actually uses.
- Adding new tracking and chat tools without removing the ones they no longer use.
- Ignoring mobile because the desktop version looks fast on their office laptop.
- One-off audits with no recurring check, so regressions go unnoticed until traffic drops.
Avoid those and you are already doing better than most.
Run a Full Audit in One Step
Working through PageSpeed Insights page by page is fine for a small audit. If you want one consolidated report across your top pages — with the diagnostics translated into plain-English fixes prioritized by impact — run a free audit with FreeSiteAudit. It checks your Core Web Vitals along with the other technical, SEO, and accessibility issues that affect how your site performs, and gives you a prioritized action list you can hand to a developer or work through yourself.
You will know in a few minutes what to fix first, what to leave alone, and what is quietly costing you visitors right now.
Sources
Related Tools
Check your website for free
Get an instant score and your top 3 critical issues in under 60 seconds.
Get Your Free Audit →