GTmetrix vs WebPageTest: Which Speed Tool Should You Use?
A plain-English comparison of GTmetrix and WebPageTest for small business owners who need to fix a slow website without hiring a developer or an agency.
# GTmetrix vs WebPageTest: Which Speed Tool Should You Use?
If you've ever Googled "why is my website slow," you've probably landed on two names within five minutes: GTmetrix and WebPageTest. Both are free. Both produce a long report. Both throw enough jargon at you to make you close the tab.
This guide is for the small business owner, the marketer running a Shopify store, or the solo founder trying to fix a slow site without hiring an agency. We'll compare the two tools honestly, show what each is actually good at, and give you a simple way to pick one.
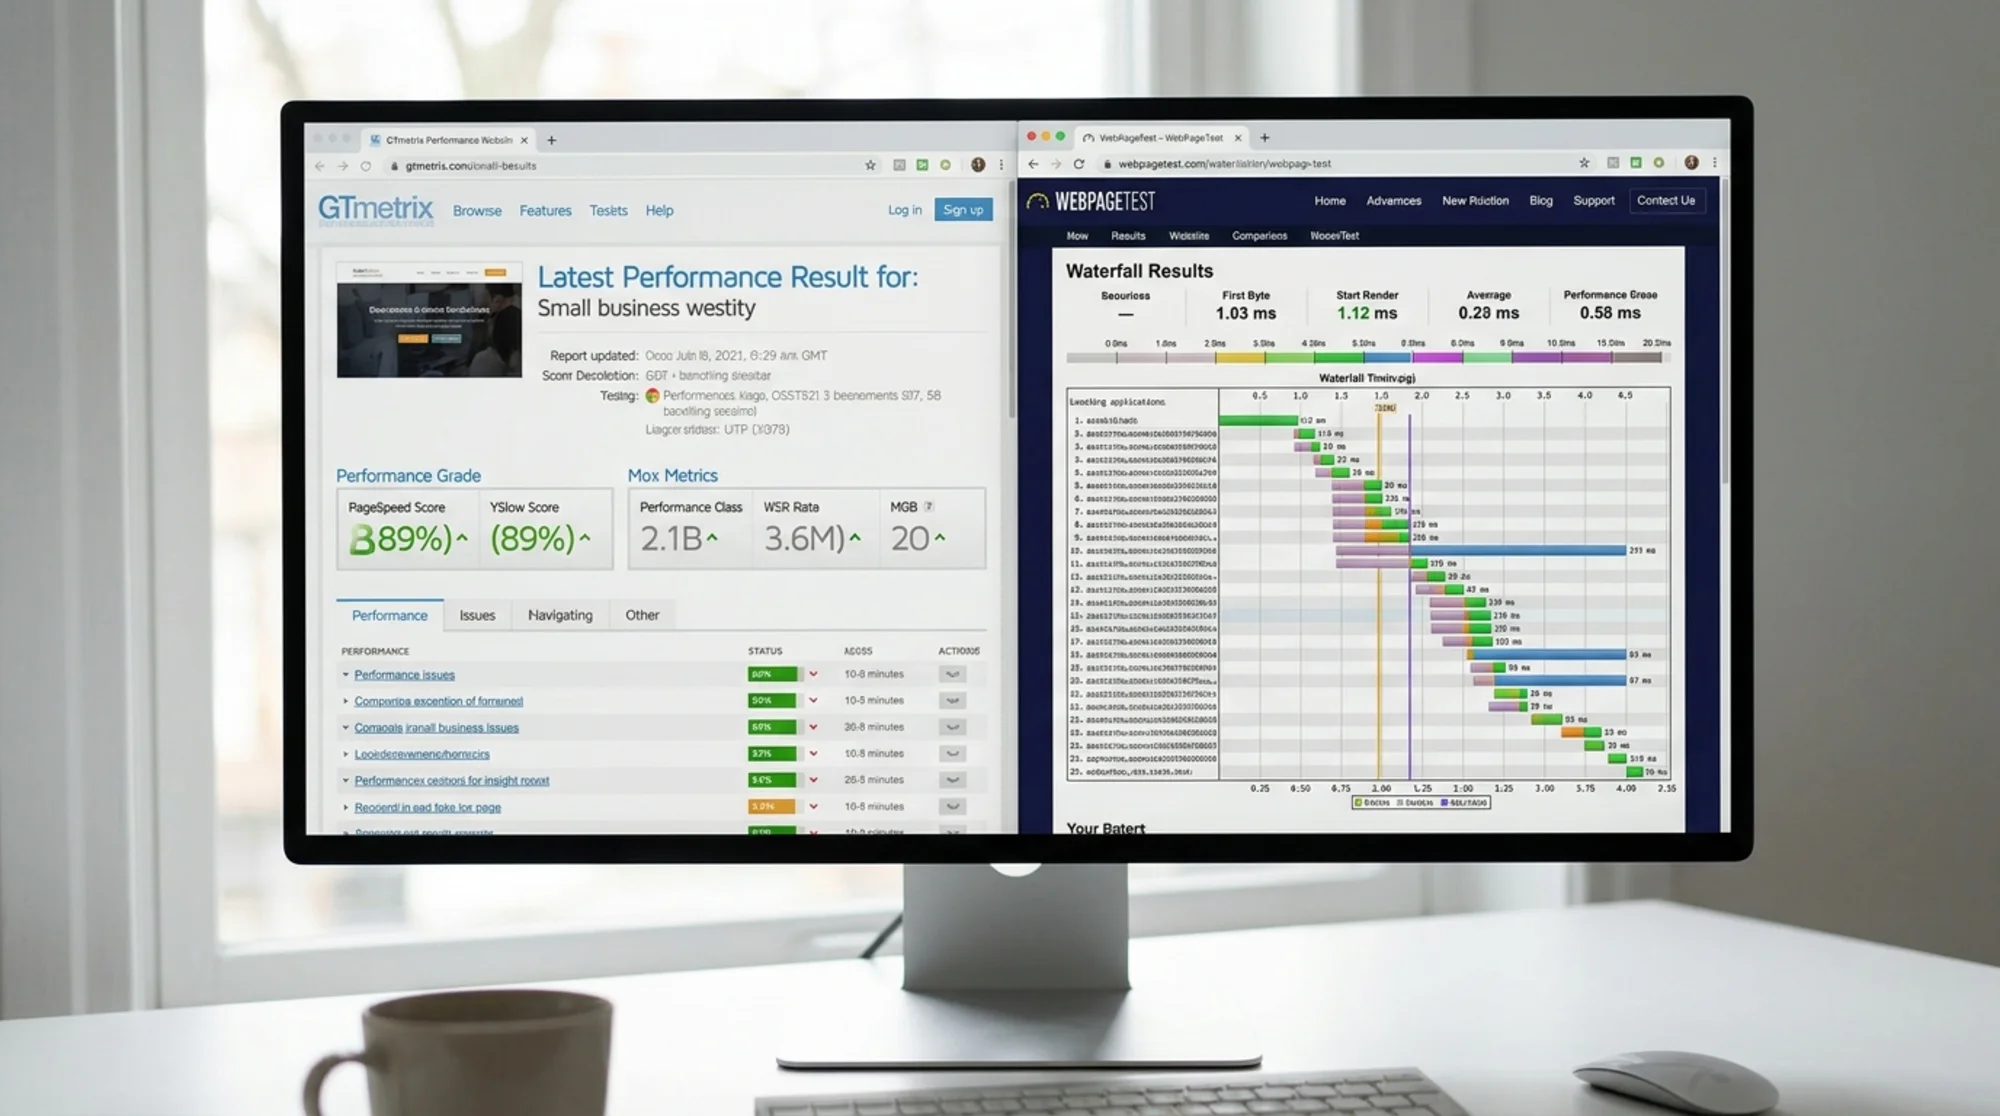
The short answer
If you're a non-technical owner who wants a quick read on your site's speed and a plain list of what to fix: use GTmetrix.
If you're trying to debug a specific slowness problem, test from a particular country, or hand a report to a developer: use WebPageTest.
Most small business owners should start with GTmetrix. Pull out WebPageTest when GTmetrix says something is slow but you can't figure out why. The rest of this article explains the reasoning, with concrete examples.
What both tools actually do
Both tools load your website in a real browser, in a test environment somewhere on the internet, and record exactly what happens: which files download, in what order, how long each one takes, and when the page becomes usable.
They both report on what Google calls Core Web Vitals — the three metrics Google uses to judge page experience for search rankings:
- Largest Contentful Paint (LCP): how fast the biggest visible thing on your page (usually a hero image or headline) appears. Good is under 2.5 seconds.
- Interaction to Next Paint (INP): how quickly your page responds when someone taps or clicks. Good is under 200 milliseconds.
- Cumulative Layout Shift (CLS): how much stuff jumps around while the page loads. Good is under 0.1.
If those three are good, your site feels fast to real visitors. Both tools measure them. The difference is in how they present the results.
GTmetrix: the dashboard tool
GTmetrix gives you a letter grade — A, B, C, D, or F — for performance and structure. You see it the moment the test finishes. There's a circular gauge, a list of "top issues," and a one-line description for each problem.
Where GTmetrix wins
- You see your score instantly. No interpretation needed. A green A means you're fine. A red D means you have work to do.
- Issues are written in something close to English. "Eliminate render-blocking resources" is still jargon, but GTmetrix puts a short explanation under each item and shows you exactly which files are causing the issue.
- You can save a history. Free accounts can run tests and compare results over time, useful for confirming a recent change actually moved the needle.
- It looks like a dashboard. For non-technical owners, this matters. You can show it to a partner or a freelancer without explaining what they're looking at.
Where GTmetrix falls short
- Limited test locations on free accounts. You can only test from Vancouver by default. Paid plans unlock more.
- The grade can be misleading. GTmetrix layers its own grading formula on top of Google's metrics, so your GTmetrix grade and your actual Core Web Vitals can disagree.
- Less detail per request. GTmetrix shows you a waterfall chart, but it's not as deep as WebPageTest's.
A typical GTmetrix workflow
You run a test on your homepage. You see a C grade. The top issue says "Largest Contentful Paint element," and it's pointing at your hero image — a 2.4 MB photo that takes 3.8 seconds to load on mobile.
You don't need to understand waterfall charts to know what to do. You compress the image, re-upload it, and run the test again. Grade goes from C to B. That's a useful afternoon.
WebPageTest: the diagnostic tool
WebPageTest looks like a tool built by engineers for engineers, because it was. It's been around since 2008. It doesn't soften the report.
You get a giant table of metrics, multiple test runs, a filmstrip view of your page loading frame by frame, and a waterfall chart that shows every single network request — usually 80 to 200 of them on a typical site.

Where WebPageTest wins
- Real network conditions. Test from over 40 locations, on real mobile devices, on throttled 4G connections. This matters if your customers are in different countries or mostly on phones.
- Filmstrip view. A frame-by-frame screenshot of your page loading. This is the single most useful feature for a non-technical owner — you can literally watch what your visitors see at 0.5 seconds, 1 second, 2 seconds.
- Waterfall depth. Every request is annotated. If a tracking pixel from a third party is blocking your page for 4 seconds, WebPageTest will name it and show you when.
- No account required. Run a test right now without signing up.
Where WebPageTest falls short
- The interface is dense. First-time visitors often bounce out without finishing the report.
- No simple grade. You see numbers and timings. There's no "you got an A" moment — you have to know what good looks like.
- No history without an account. Saved tests expire after about 13 months, and there's no easy comparison view unless you track URLs yourself.
A typical WebPageTest workflow
Your GTmetrix score is fine, but customers keep saying your checkout page feels slow. You run a WebPageTest from a US East location on a Moto G4 (a slow phone) on a 4G connection. You scroll to the filmstrip.
At 2 seconds: blank screen.
At 4 seconds: blank screen.
At 5.5 seconds: header appears.
At 7 seconds: checkout form appears.
At 8 seconds: visible content stabilizes.
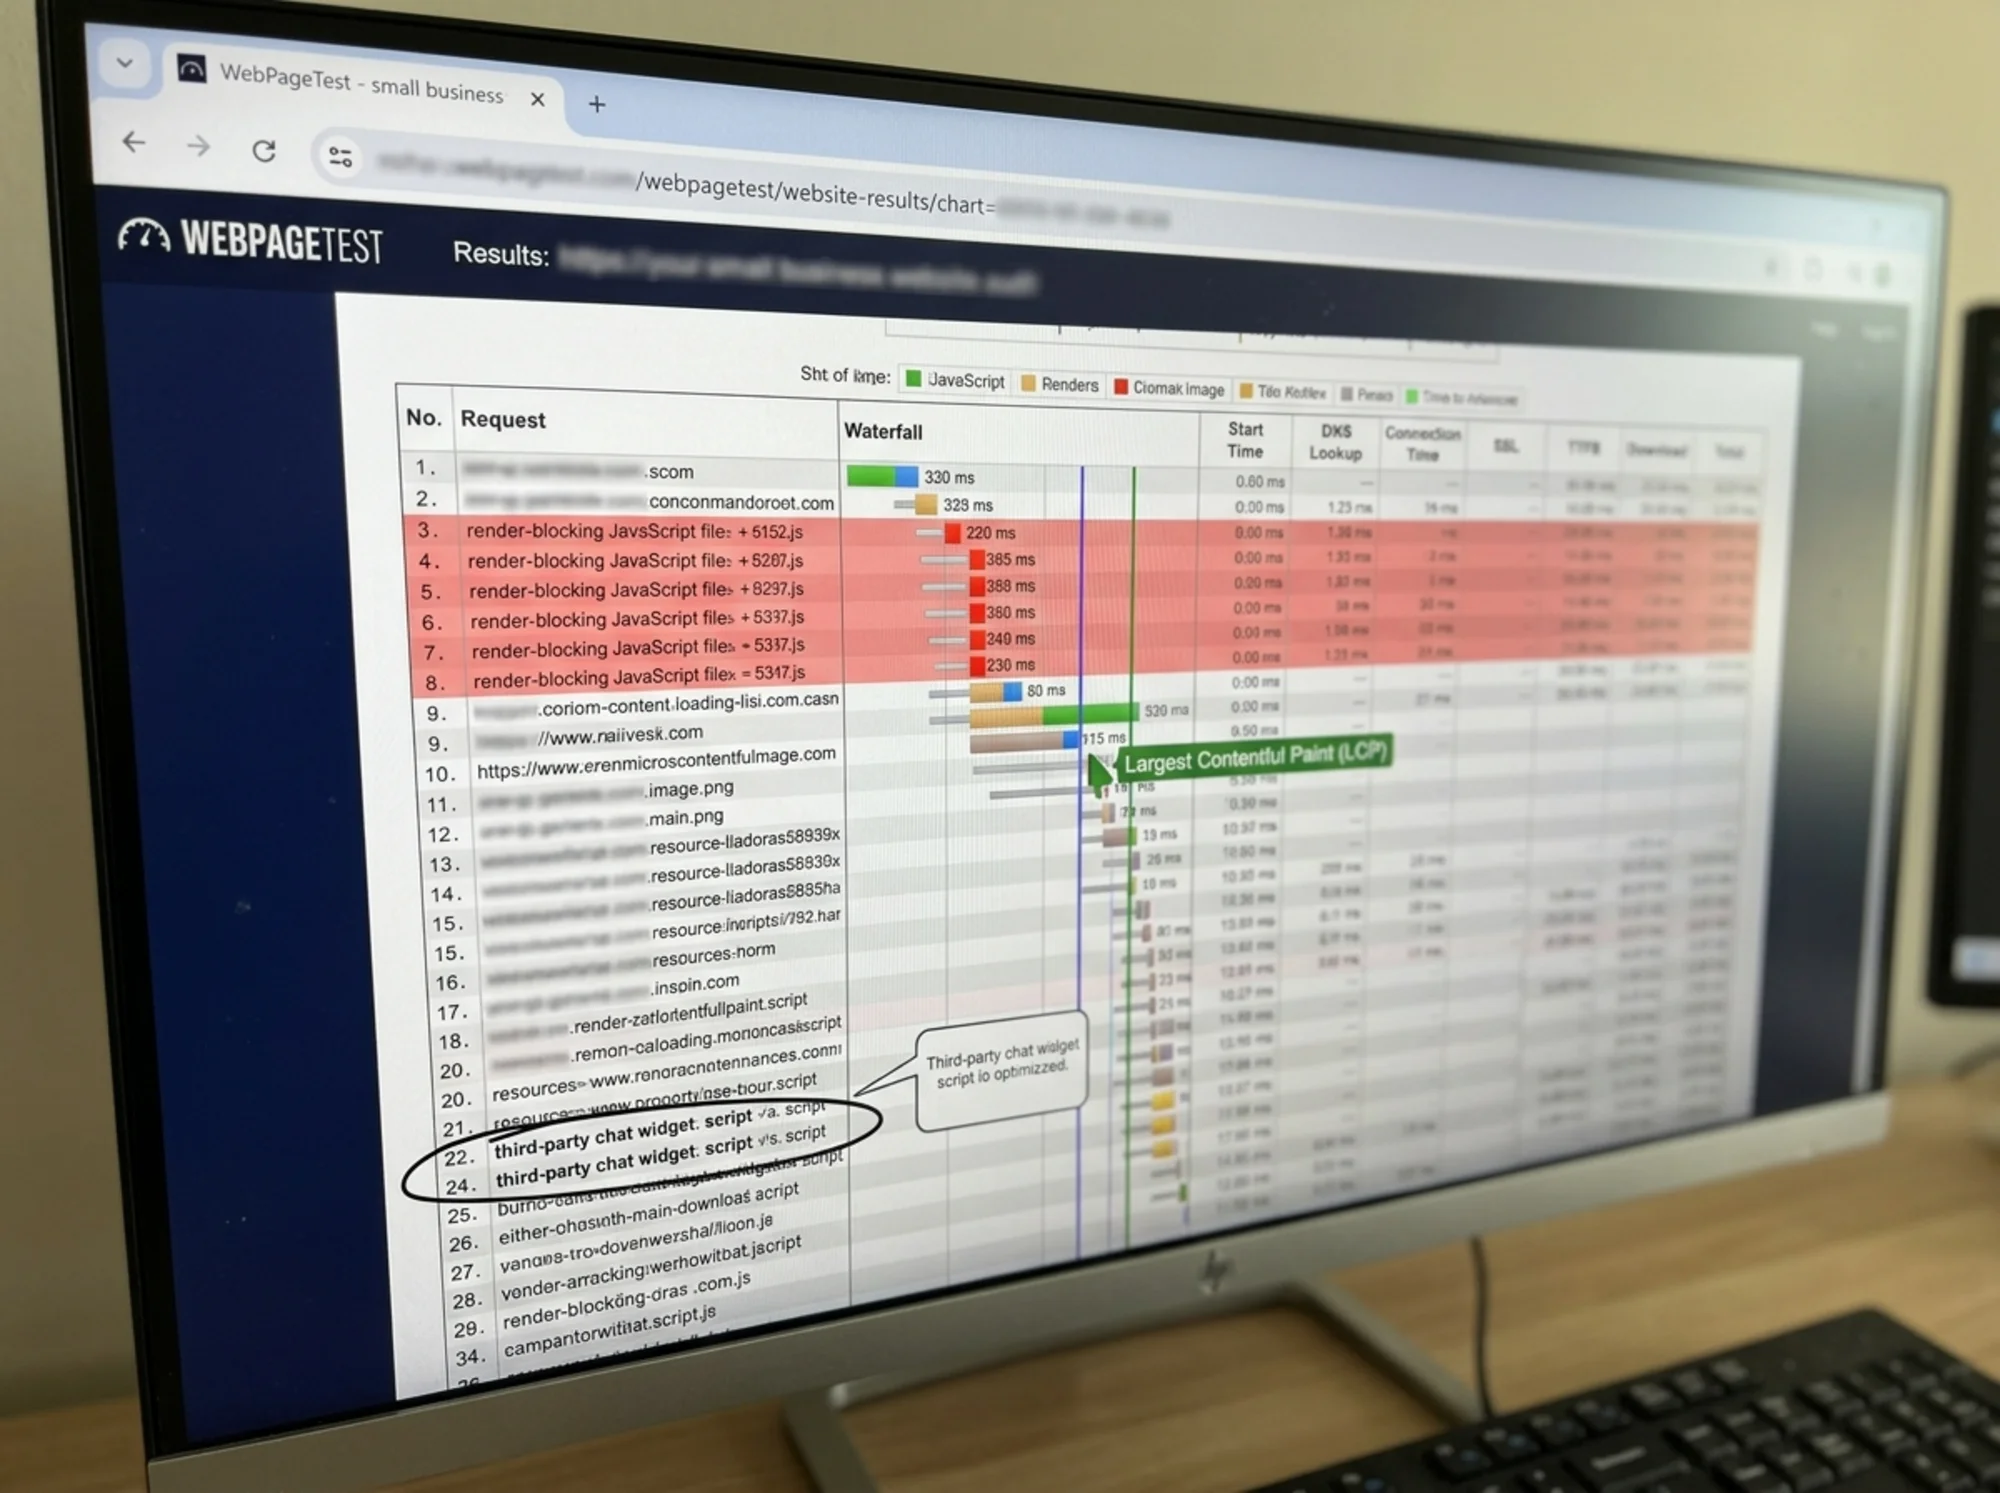
You scroll to the waterfall. A third-party chat widget is pulling in 1.2 MB of JavaScript before your page can render. You disable it on the checkout page only. The next test shows usable content at 2.1 seconds. That's the kind of fix you couldn't have found without WebPageTest.
Side-by-side: when to use which
| Situation | Use this |
|---|---|
| Quick health check on your site | GTmetrix |
| "Is my site getting faster or slower over time?" | GTmetrix (with a free account) |
| Customers in another country complain about speed | WebPageTest (test from their region) |
| You want to see what your visitors actually see | WebPageTest (filmstrip) |
| A specific page is slow and you don't know why | WebPageTest |
| You need a report to send to a freelancer | Either — WebPageTest is more useful to the developer |
| You want a single number that tells you if you're winning | GTmetrix |
The thing both tools won't tell you clearly
Both GTmetrix and WebPageTest test your site in a clean lab environment. They tell you what your site could do under ideal conditions. They don't tell you what real visitors are actually experiencing on their cheap Android phones in a coffee shop on slow Wi-Fi.
For that, you need field data — measurements collected from your actual visitors. Google's Chrome User Experience Report (CrUX) is the source, and it's what Google uses for search rankings. Both tools can surface some CrUX data, but neither makes it the headline.
If your GTmetrix grade is A but Google Search Console says your Core Web Vitals are failing, trust Search Console. It's reading real visitor data.
A walkthrough: diagnosing a slow Shopify product page
Let's say you run a Shopify store and your best-selling product page feels slow. Here's how you'd actually use both tools together.
Step 1: Quick check with GTmetrix
Run the product page URL through GTmetrix. You get a C grade. The top three issues:
- Largest Contentful Paint: 4.2 seconds
- Reduce unused JavaScript: 280 KB
- Properly size images: 1.8 MB potential savings
That's enough to act on. Compress the main product image. Remove the two apps you stopped using six months ago that are still loading their scripts. Re-test. If that takes you from a C to a B, you might stop there. Done.
Step 2: If it's still slow, switch to WebPageTest
GTmetrix says you're at a B, but the page still feels sluggish on your phone. Run the same URL through WebPageTest with a slow mobile profile — "Motorola G (gen 4) - Chrome - 3GFast" is a good default.
Look at the filmstrip. You'll see exactly when the product image appears, when the "Add to Cart" button becomes clickable, and when third-party widgets (review apps, chat widgets, upsell apps) start loading.
The waterfall will reveal which Shopify app is the worst offender. It might be a review app loading 600 KB of JavaScript before showing a single review.
Step 3: Fix the specific bottleneck
Once WebPageTest points at the culprit, you have options. Disable the app on that specific page template. Lazy-load it after the main content. Replace it with a lighter alternative. Each is a 15-minute fix once you know what to fix.
A mini-checklist for any small business owner
Whether you use GTmetrix, WebPageTest, or both, here's what to actually do with the results:
- Test your homepage and your single highest-traffic page (often a product or blog post, not the homepage)
- Test on mobile, not just desktop — that's where 60-70% of small business traffic lives
- Write down your current LCP, INP, and CLS numbers
- Pick the top 3 issues only — ignore the rest until those are fixed
- Re-test after each change so you know what worked
- Check Google Search Console once a month to see what real visitors are experiencing
Most performance gains come from fixing the biggest 2-3 problems. The rest is diminishing returns.

Common mistakes to avoid
- Chasing a 100/100 score. Past 90, the time you spend optimizing rarely pays back. Visitors can't tell the difference between a 92 and a 98.
- Testing the homepage only. Your homepage is usually the fastest page on your site because you've optimized it. Product pages, blog posts, and checkout are where revenue lives.
- Running one test. Performance varies. Run 3 tests and take the median.
- Optimizing for the wrong location. If your customers are in Toronto, don't test from Singapore.
- Ignoring third-party scripts. Chat widgets, tracking pixels, review apps, popup tools — the silent killers of small business sites. Both tools will flag them; you have to act.
So which one should you use?
For most small business owners reading this: start with GTmetrix this week. Run your top 3 pages. Fix the top issue on each. Re-run. That's a meaningful afternoon of work, and it'll move your real metrics.
If you hit a wall — GTmetrix says everything is fine but customers still complain, or a specific page is mysteriously slow — switch to WebPageTest and use the filmstrip. It's the most under-used feature in small business web optimization.
You don't have to pick one forever. They're free. Use the one that answers the question you have.
Skip the tool-hopping with a guided audit
Running speed tests is one piece of a site audit. The other pieces — SEO, accessibility, broken links, missing meta tags, schema markup, mobile usability — usually require three or four more tools. And then you still have to interpret everything in plain English.
Run a free website audit with FreeSiteAudit and you'll get a single report covering speed, SEO, accessibility, and content issues, written in plain language with prioritized fixes. Takes about 60 seconds. No credit card.
If you want to dig into specific issues afterward, our page speed checker, LCP fix guide, and render-blocking JavaScript guide are good next stops. Running an ecommerce store? Our ecommerce audit guide covers the page types that matter most for sales.
Sources
Related Tools
Related Fixes
Check your website for free
Get an instant score and your top 3 critical issues in under 60 seconds.
Get Your Free Audit →