Homepage Speed vs Service-Page Speed: Which Matters More?
Your homepage might load fast, but your service pages could be losing customers. Learn which pages need speed optimization most and where to focus first.
# Homepage Speed vs Service-Page Speed: Which Matters More?
Most small business owners check their website speed by testing one page: the homepage. It loads in two seconds, they feel good, and they move on.
Meanwhile, their "Kitchen Remodeling" service page takes six seconds to load on mobile. Their "Emergency Plumbing" page has a 4.8-second Largest Contentful Paint. The landing page they're running Google Ads to scores 31 on PageSpeed Insights.
Your homepage is rarely where the money is made. Service pages, location pages, and landing pages do the heavy lifting — and they're usually the slowest pages on your site.
Here's how to figure out which pages actually matter for speed, why service pages tend to be slower, and where to focus your optimization effort.
Why Everyone Tests the Homepage (And Why That's a Problem)
Testing the homepage is a habit. It's the page you know best, and it's the default for every speed-testing tool. Type your domain into PageSpeed Insights, and that's what gets tested. Speed reports from hosting providers and site builders almost always benchmark the root URL. If you hired a web designer and they handed you a speed report, chances are it showed the homepage and nothing else.
But think about how people actually find your business:
- Someone searches "roof repair Austin TX" — they land on your roof repair service page
- Someone clicks your Google Ads campaign — they land on a specific landing page
- Someone taps "Website" on your Google Business Profile — they often land on a location or services page
- Someone finds you in a local directory listing — they land on whatever page the directory links to
- Someone searches your exact business name — now they land on the homepage
Only that last scenario hits the homepage directly. Your service pages and landing pages are the real front door.
Google knows this too. Core Web Vitals are measured from real-user data across every page people visit, not just the homepage. If your service pages are slow, that drags down your site-wide performance — even if your homepage is fast.
This creates a blind spot that's surprisingly common. A business owner checks their site speed once a quarter, sees a green score, and assumes the whole site is healthy. In reality, the pages doing the most commercial work — the ones people find through search, click through from ads, and use to decide whether to call — might be performing terribly.

What the Data Actually Says
Google's Core Web Vitals measure three things on every page:
- Largest Contentful Paint (LCP) — how fast the main content appears (target: under 2.5 seconds)
- Interaction to Next Paint (INP) — how quickly the page responds to taps and clicks (target: under 200 milliseconds)
- Cumulative Layout Shift (CLS) — how much the page jumps around while loading (target: under 0.1)
These metrics come from real Chrome users visiting your actual pages. Google uses this data in rankings on a page-level basis — a slow service page can rank poorly even if the rest of your site is fast.
Google's documentation on page experience confirms that speed acts as a ranking tiebreaker when multiple pages offer similar content quality. If your competitor's "HVAC Installation" page loads in 1.8 seconds and yours loads in 5.2 seconds with comparable content, Google will favor the faster page.
What makes this especially important for small businesses is that local service searches are highly competitive. There are usually a dozen plumbers, dentists, or roofers in any metro area with similar content quality. At that point, page experience becomes the deciding factor. The business with the fastest, smoothest-loading service pages gets the slight edge — and slight edges compound across hundreds of searches per month.
It's also worth understanding that Google separates mobile and desktop Core Web Vitals data. A page might pass on desktop but fail on mobile. Since the majority of local searches happen on phones — Google reports that over 60% of searches are mobile — the mobile score is what matters most for local businesses.
Why Service Pages Are Almost Always Slower
The homepage loads fast because it's relatively simple: a hero image, some text, a few icons, and a call-to-action. Service pages accumulate heavier elements over time:
Large image galleries. A landscaping company's "Patio Design" page might have 15 before-and-after photos at 2-4 MB each because nobody resized them after uploading. Photos taken on modern phones are routinely 4-8 MB in their original format. Upload a dozen of those without compression and a single page can weigh 50 MB or more.
Embedded videos. A YouTube embed loads the entire player framework — roughly 1.5 MB of JavaScript — whether anyone plays the video or not. Multiple embeds on a single page multiply that cost. A page with three customer testimonial videos can add 4-5 MB of overhead before a single frame of video has played.
Page-specific widgets. A booking calendar on your consultation page, a cost calculator on pricing, a review carousel on your about page. Each adds external scripts that only affect that page. These widgets often load their own CSS, fonts, and JavaScript libraries, creating a cascade of network requests that compete with your actual content for bandwidth.
Heavier content structure. Service pages tend to have FAQ sections, comparison tables, testimonial blocks, and detailed descriptions — all requiring additional CSS and JavaScript to render, and each creating opportunities for layout shifts. Accordion-style FAQ sections are a common culprit for CLS issues, as expanding and collapsing content pushes elements around the page.
Third-party review widgets. Many businesses embed Google Reviews, Yelp badges, or Trustpilot widgets on service pages to build trust. Each of these loads external scripts, stylesheets, and API calls that add seconds to load time.
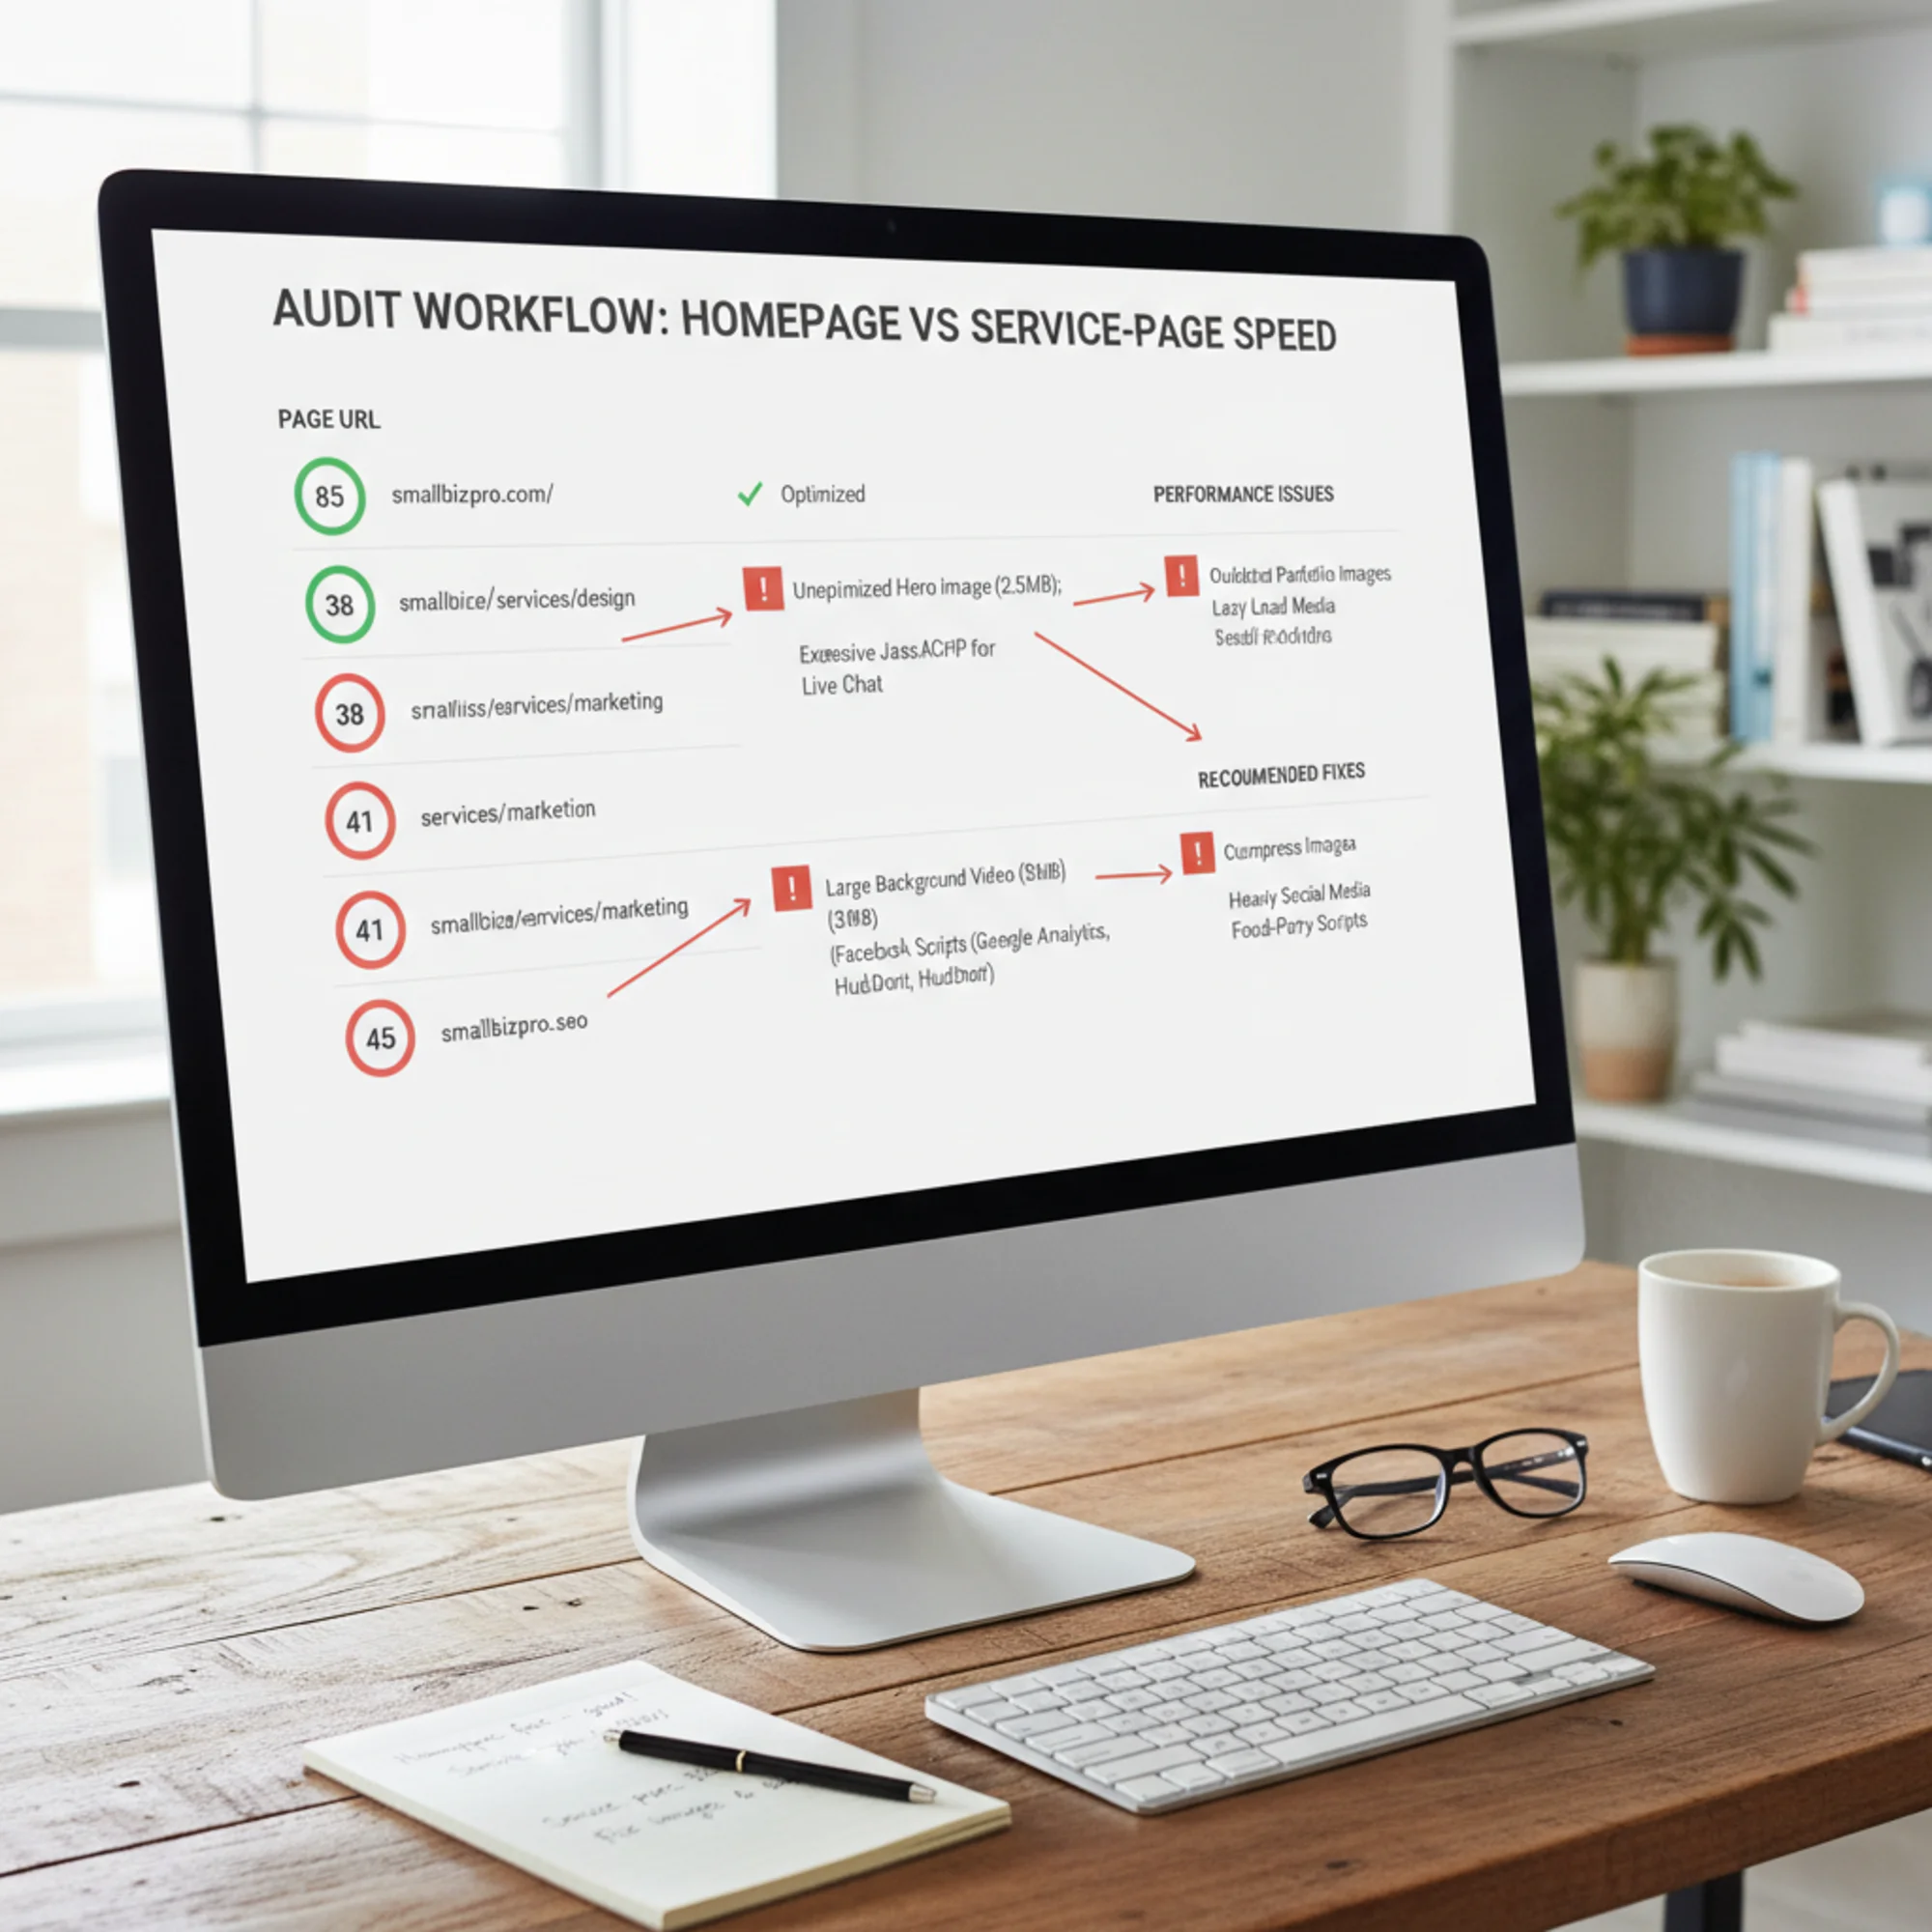
The result: your homepage scores 85 on mobile PageSpeed, and your most important service page scores 45.
A Real Scenario: The Dentist With a Fast Homepage
Dr. Martinez runs a dental practice in Denver. Her homepage loads in 2.1 seconds on mobile — solid performance. But her actual traffic tells a different story:
| Page | Monthly Visits | Mobile Load Time | Conversion Rate |
|---|---|---|---|
| Homepage | 800 | 2.1s | 1.2% |
| Teeth Whitening | 1,400 | 5.8s | 0.4% |
| Dental Implants | 1,100 | 6.3s | 0.3% |
| Emergency Dental | 900 | 4.9s | 0.6% |
| Contact/Book | 600 | 3.4s | 3.1% |
Her service pages get more traffic than her homepage because people search for specific procedures. But those pages are dramatically slower.
The "Dental Implants" page loads 11 MB on mobile: eight unoptimized before-and-after photos, an embedded YouTube testimonial, and a third-party financing calculator. If Dr. Martinez only tested her homepage, she'd think everything was fine while the pages generating appointments were driving visitors away.
Let's do the math on what this costs. Industry data consistently shows that each second of additional load time reduces conversions by roughly 7-10%. Dr. Martinez's "Dental Implants" page loads in 6.3 seconds instead of a target 2.5 seconds — that's nearly 4 seconds of excess delay. At 1,100 monthly visitors, even modest conversion rate improvements translate to real appointments.
If optimizing the page from 6.3 seconds to 2.5 seconds doubled the conversion rate from 0.3% to 0.6%, that's 3 additional appointment requests per month. For a dental implant procedure averaging $3,000-$5,000 in revenue, that's $9,000-$15,000 in potential monthly revenue from fixing a single page. The homepage, by contrast, is already fast and has lower commercial intent traffic.
This pattern repeats across industries. A roofing company's "Storm Damage Repair" page matters more than the homepage during hail season. A law firm's "Car Accident Attorney" page matters more than the generic homepage. The pages tied to specific, high-intent searches are almost always the ones that need speed attention most.
How to Figure Out Which Pages Need Attention
Step 1: Identify Your High-Traffic Pages
Check your analytics for the top 10 most-visited pages over the last 90 days. If you don't have analytics, look at which pages you send paid traffic to, which services you promote most, and which pages you link from your Google Business Profile.
Also consider seasonal patterns. A tax accountant's "Tax Preparation" page might get 80% of its annual traffic in three months. An HVAC company sees spikes on "AC Repair" pages when summer hits. Test the pages that will carry the heaviest load during your busiest period — don't wait until peak season to discover they're slow.
Step 2: Test Each Page Individually
Test each important page URL separately — not just your domain. You can run a free audit on each page to see exactly where the bottlenecks are.
For each page, note:
- Mobile speed score (the number that matters most for local search)
- LCP time (is the main content appearing within 2.5 seconds?)
- Total page weight in MB (anything over 3 MB on mobile is a red flag)
- Number of requests (each request adds latency; over 80 requests signals bloat)
- Third-party script count (external scripts you don't control are often the worst offenders)
Write these down in a simple spreadsheet. Seeing the numbers side by side makes the problem obvious.
Step 3: Rank by Impact
| Page | Traffic | Speed Score | Revenue Impact | Priority |
|---|---|---|---|---|
| /services/kitchen-remodel | High | 38 | High | Fix first |
| /services/bathroom-remodel | Medium | 42 | High | Fix second |
| /about | Medium | 71 | Low | Can wait |
| / (homepage) | High | 82 | Medium | Already OK |
| /gallery | Low | 29 | Low | Fix later |
Focus on pages that combine high traffic, low speed score, and high revenue impact. That's almost always service pages and landing pages.
A useful shortcut: if you're running Google Ads, start with your ad landing pages. You're paying for every click to those pages, so every visitor who bounces because of slow loading is wasted ad spend. Improving the speed of a paid landing page has an immediate, measurable return.
The Fix: Page-by-Page Speed Checklist
Work through this list for your worst-performing pages first. The items are ordered by typical impact — start at the top and work down.
Images (Usually the Biggest Win)
Images are responsible for the majority of page weight on most small business sites. Fixing images alone often cuts load time in half.
- [ ] Serve images in WebP or AVIF format instead of PNG/JPEG (WebP is 25-35% smaller at equivalent quality)
- [ ] Size images to actual display dimensions (a 300px thumbnail doesn't need a 3000px source file)
- [ ] Add lazy loading to images below the fold so they only load when the visitor scrolls to them
- [ ] Preload the hero image for faster LCP — this tells the browser to fetch it immediately instead of discovering it after parsing the CSS
- [ ] Remove duplicate or near-duplicate images (common in galleries where the same photo appears in multiple sizes)
- [ ] Set explicit width and height attributes on all images to prevent layout shift as they load
Third-Party Scripts
External scripts are the second biggest offender because they load resources from servers you don't control.
- [ ] Replace YouTube/Vimeo embeds with a static thumbnail that loads the player on click (saves 1-2 MB per embed). This technique is called "facade loading" and is one of the highest-impact fixes available
- [ ] Defer booking widgets, chat widgets, and calculators until after the page becomes interactive
- [ ] Replace social media embeds with a screenshot and link
- [ ] Audit Google Tag Manager containers — they often load dozens of tags that add up to significant overhead
- [ ] Move non-essential tracking scripts (heatmaps, A/B testing tools) to load after the page is fully interactive
Page-Specific Bloat
Each page may have unique problems that don't appear site-wide.
- [ ] Remove CSS or JavaScript this page loads but doesn't use
- [ ] Remove fonts loaded on this page that aren't displayed here
- [ ] Replace sliders or carousels with static images where possible (sliders rarely increase engagement and always increase load time)
- [ ] Simplify complex animations or parallax effects on mobile — they cause jank on lower-powered devices and hurt INP scores
- [ ] Check for redundant plugins or scripts loaded by your CMS that this page doesn't need
Server and Caching
If the server itself is slow, no amount of front-end optimization will make the site feel fast.
- [ ] Cache the page instead of rebuilding from the database on every visit
- [ ] Serve static assets (images, CSS, JavaScript) with long cache headers so repeat visitors load them instantly
- [ ] Confirm server response time (Time to First Byte) is under 600ms — if not, the hosting may be underpowered for your traffic
- [ ] Enable text compression (Gzip or Brotli) for HTML, CSS, and JavaScript files
- [ ] Consider a CDN if your visitors are spread across a wide geographic area
For detailed fix instructions on each of these items, see our page speed troubleshooting guide.
When the Homepage Actually Does Matter
Homepage speed is still important in specific scenarios:
Brand searches. When someone searches your business name, they land on the homepage. For well-known local brands, this can be significant traffic. A popular restaurant or established law firm might get hundreds of brand searches per month.
Direct traffic. Visitors from emails, social media profiles, business cards, and typed URLs usually hit the homepage. If you're running email marketing campaigns that link to the homepage, slow loading directly reduces campaign effectiveness.
Mid-session navigation. Many visitors land on a service page, then click to the homepage to learn about the business before converting. A slow homepage breaks that journey mid-flow. This "service page → homepage → contact page" path is extremely common for considered purchases like home renovation, legal services, or medical procedures.
First impressions for referral traffic. When someone mentions your business and a friend types in your URL, the homepage is their first experience. A slow homepage creates an immediate negative impression that colors how they perceive the rest of the site.
Homepage speed isn't irrelevant — it's just not the whole picture and rarely the most impactful place to start optimizing. Think of it as one page among many that deserves attention, not the only benchmark that matters.
The Right Way to Think About Site Speed
Instead of asking "is my website fast?" ask "are my money pages fast?"
Your money pages are:
- Service pages that rank in Google for what you do
- Landing pages you send ad traffic to
- Location pages if you serve multiple areas
- Contact and booking pages where conversions happen
- The homepage as a navigation and brand hub
Test all five categories. Optimize in order of traffic multiplied by revenue impact.
Most small business sites have the same root problems repeated across pages — unoptimized images, heavy third-party scripts, and poor caching. Fix the root causes once, and most pages improve together. The exceptions are page-specific embeds and widgets, which need individual attention but are also usually the highest-impact fixes.
One useful framework: set a performance budget for each page type. For example, service pages should be under 2 MB total weight and load in under 3 seconds on a 4G connection. Landing pages for paid campaigns should be under 1.5 MB and load in under 2 seconds — you're paying for that traffic, so speed has a direct financial return. Homepages can be slightly heavier if needed, but should still target sub-3-second loads.
When you add new content or features to any page, check the speed impact before publishing. A new image gallery, embedded map, or review widget can silently add seconds to load time. Building speed checks into your content workflow prevents the gradual degradation that makes sites slow over months and years.
Quick-Start Priority List
If you're not sure where to begin, follow this order:
- Test your top 5 service pages for mobile speed — not the homepage. Record the scores so you have a baseline.
- Fix images site-wide. Convert to WebP, resize to display dimensions, add lazy loading. This handles 50-70% of the problem on most sites and is the single highest-leverage change you can make.
- Audit third-party scripts page by page. Defer or lazy-load heavy widgets. Pay special attention to video embeds, chat widgets, and review platforms.
- Check your hosting. If server response times exceed 800ms, no front-end optimization will make the site feel fast. You may need to upgrade your hosting plan or switch providers.
- Optimize the homepage — just don't stop there. Apply the same fixes you used on service pages.
- Monitor ongoing. Plugin updates, new content, and added features quietly degrade speed over time. Set a monthly reminder to re-test your top pages so problems don't accumulate unnoticed.

Run a Full Site Speed Audit — Free
Most speed tools test one page at a time and leave you guessing about the rest. FreeSiteAudit gives you a complete picture — testing the pages that actually matter for your business, not just the homepage.
Run your free website audit now and see which pages are fast, which are slow, and what to fix first. No signup required, results in under a minute.
Sources
- Google Search Central — Creating Helpful, Reliable, People-First Content: https://developers.google.com/search/docs/fundamentals/creating-helpful-content
- web.dev — Web Vitals: https://web.dev/articles/vitals
- Google Search Central — Article Structured Data: https://developers.google.com/search/docs/appearance/structured-data/article
Related Tools
Related Fixes
Check your website for free
Get an instant score and your top 3 critical issues in under 60 seconds.
Get Your Free Audit →