Hosting vs Optimization: When the Server Is the Real Problem
Learn how to tell if slow load times come from poor hosting or unoptimized code. Diagnose TTFB, server response, and page weight to fix the real bottleneck.
# Hosting vs Optimization: When the Server Is the Real Problem
You've compressed your images. You've removed a couple of plugins. Maybe you even paid someone to "speed up" your site. But the loading spinner is still there, and your customers are still leaving before the page finishes rendering.
Here's the uncomfortable truth most speed guides skip: sometimes your website code isn't the problem. Your server is.
The difference matters because the fixes are completely different. Spending weeks optimizing images and scripts won't help if your server takes three seconds just to start responding. And switching hosts won't help if your page ships 4MB of uncompressed JavaScript.
This guide will help you figure out which problem you actually have — and what to do about it.

The Two Kinds of "Slow"
When someone says their website is slow, they usually mean one of two things:
Slow to start: The browser sends a request and waits. The screen stays blank for one, two, maybe three seconds before anything appears at all.
Slow to finish: The page starts loading but then drags. Images pop in late. Text jumps around. Buttons don't work for several seconds after they appear.
These are fundamentally different problems.
The first — slow to start — is almost always a server problem. Your hosting provider is taking too long to process the request and send back the first byte of data.
The second — slow to finish — is usually an optimization problem. Your page has too much stuff: large images, render-blocking CSS, excessive JavaScript, too many third-party scripts.
You can have both at once, but you need to know which one is dominant before you start spending money or time on fixes.
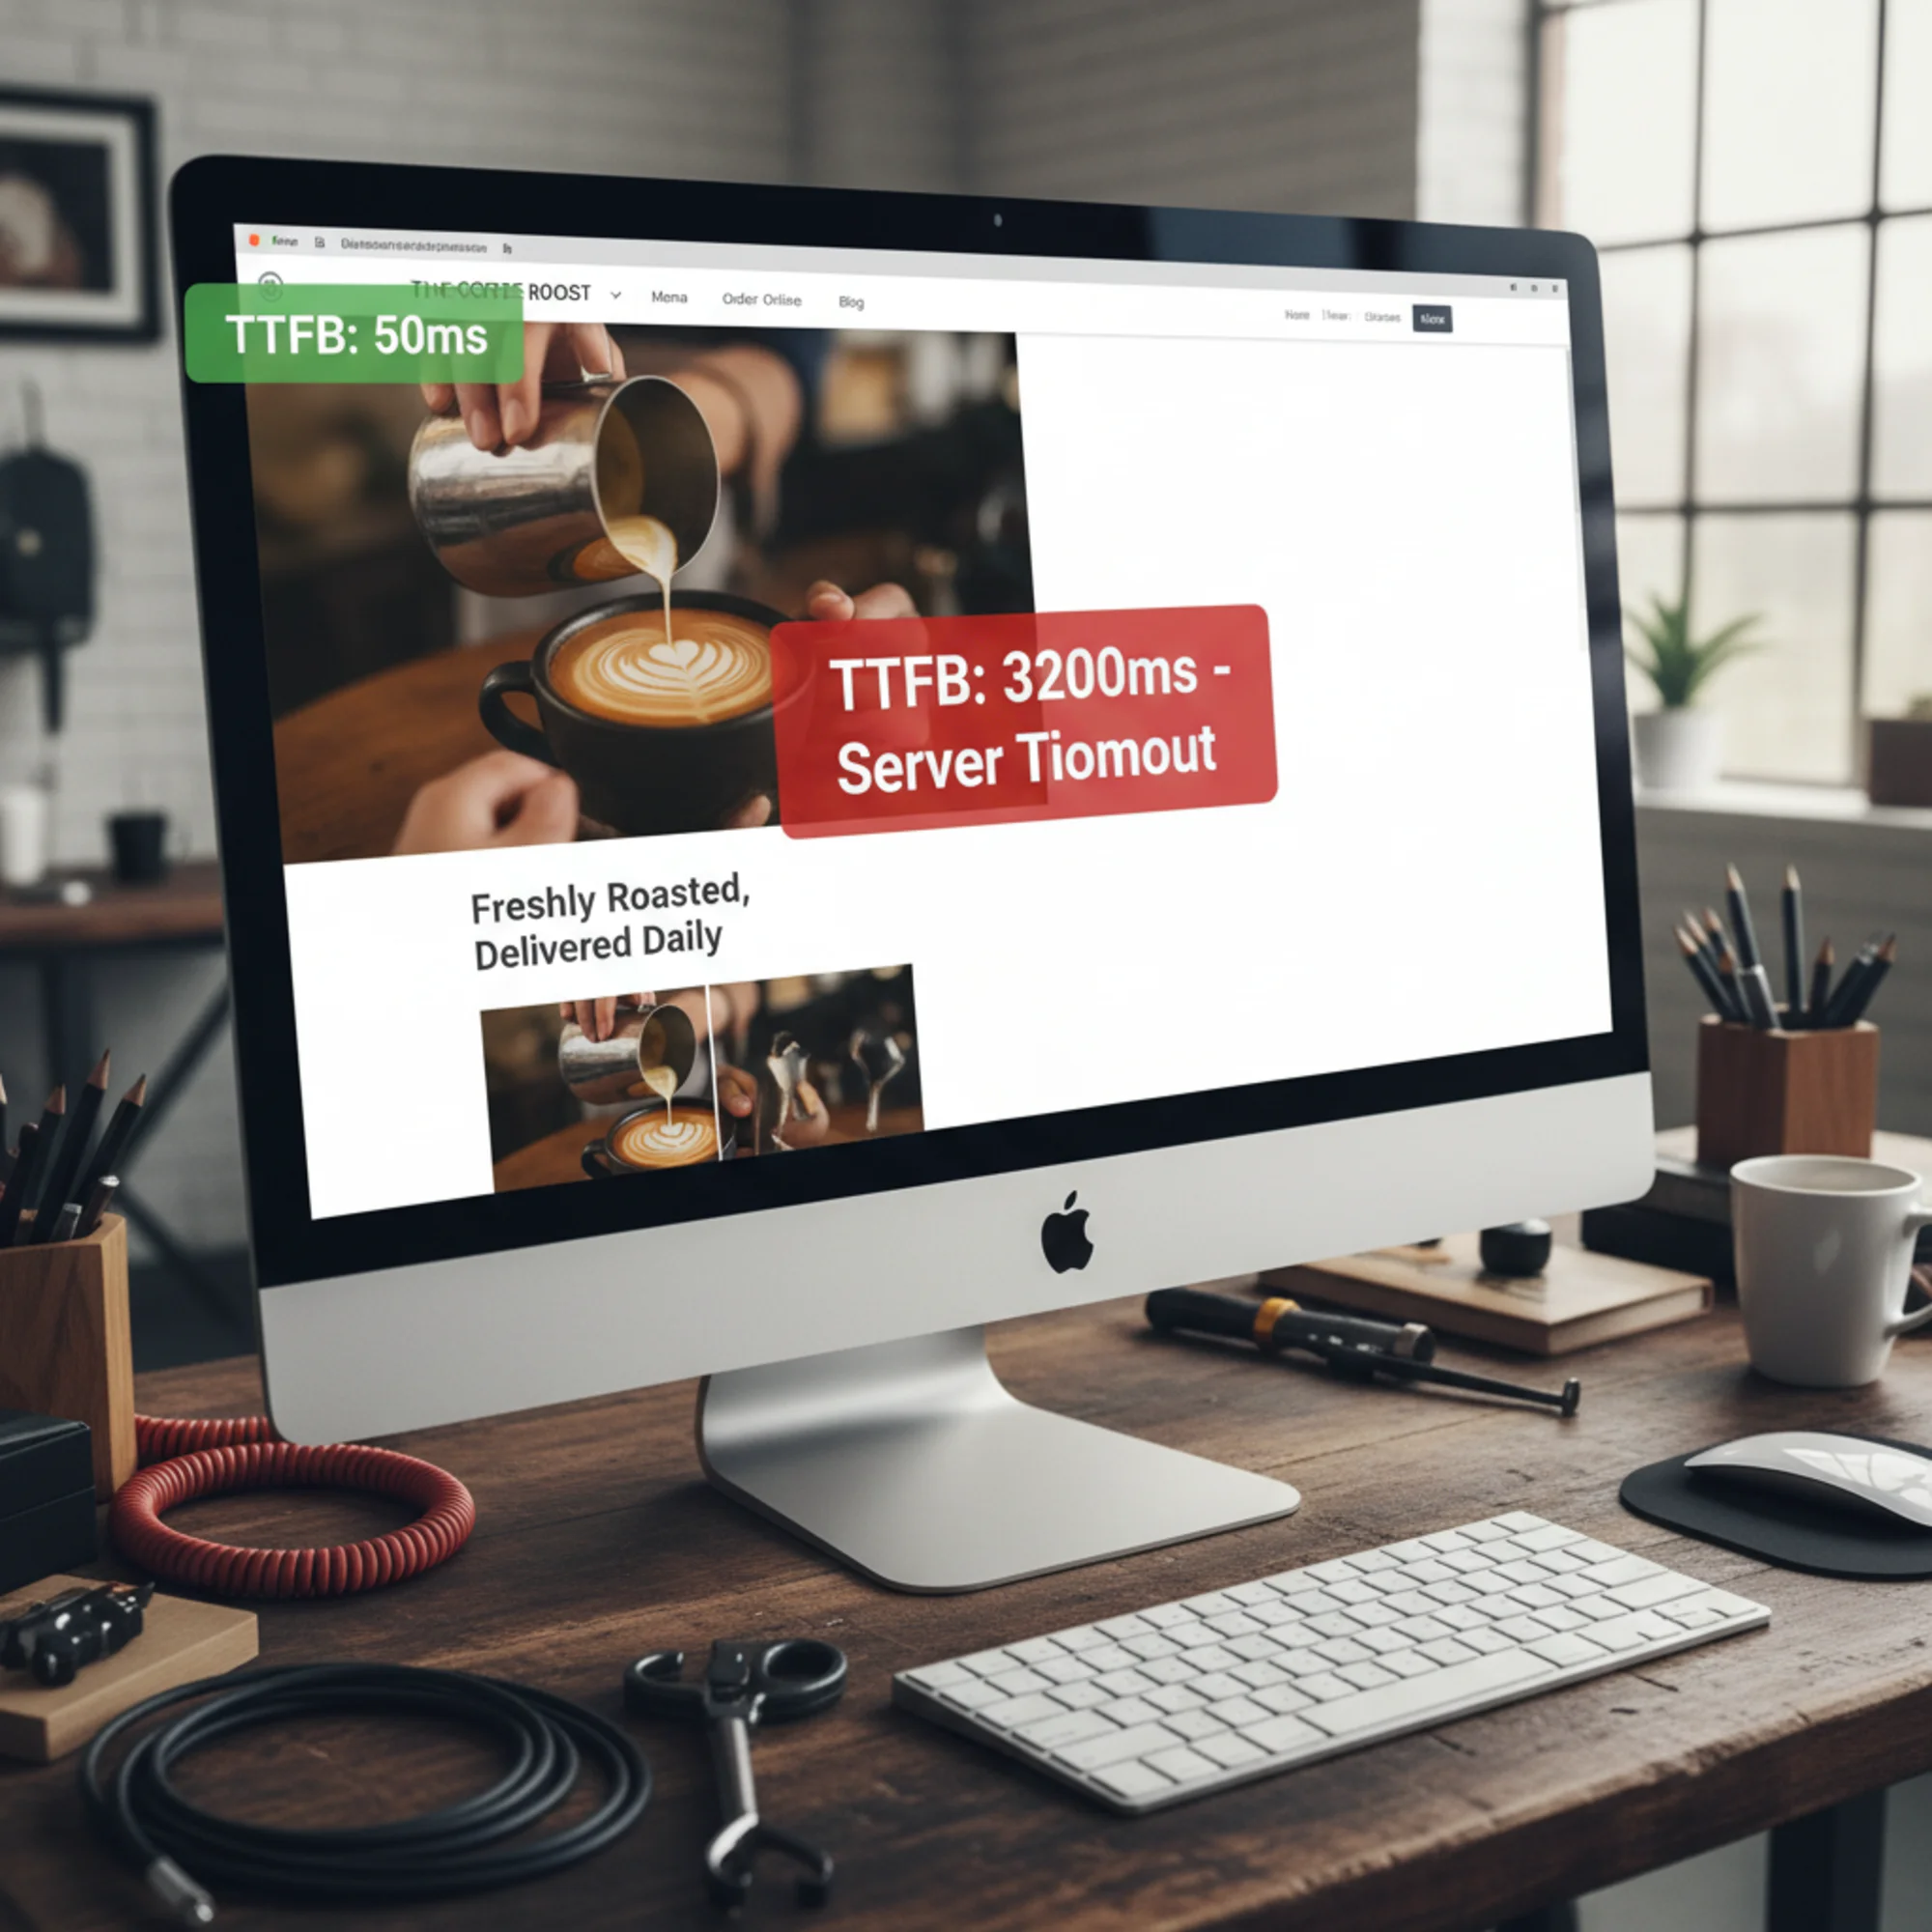
What TTFB Tells You (and Why It Matters)
TTFB stands for Time to First Byte. It measures how long it takes from the moment a browser requests your page to the moment it receives the very first byte of the response.
Think of it like ordering food at a restaurant. TTFB is the time between placing your order and seeing the waiter start walking toward your table. It doesn't measure how long it takes to eat — just how long the kitchen took to start sending food out.
According to web.dev's performance guidance, a good TTFB is under 800 milliseconds. Above that, your server is meaningfully slow.
Here's what a slow TTFB usually means:
- Shared hosting overload: Your site shares a server with hundreds of other sites, and the server is overtaxed.
- No server-side caching: Every page request forces the server to rebuild the page from scratch — querying the database, running PHP, assembling the HTML.
- Distant server location: Your server is in Virginia but most of your customers are in London. Physics still applies to internet traffic.
- Underpowered hosting plan: The cheapest tier often means the least CPU, the least memory, and the slowest response times.
A fast TTFB with a slow overall page load means your server is fine — your problem is what you're sending to the browser after the server responds.
A Real-World Pattern: The Site That Blamed Its CMS
A common scenario: a small business runs a WordPress site on a $4/month shared hosting plan. The homepage takes over 6 seconds to load. They hire a freelancer who spends hours optimizing images, minifying CSS, and installing a caching plugin.
After all that work, the page loads in about 5 seconds.
The freelancer did competent work. Images were properly compressed. CSS was minified. The caching plugin was configured correctly. But the TTFB was still hovering near 3 seconds. The server itself was taking that long before it even started sending the page.
When the site moves to a $20/month managed WordPress host, TTFB drops to around 350 milliseconds — without changing anything else. Total page load falls under 2 seconds.
The optimization work wasn't wasted — it contributed roughly a one-second improvement. But the hosting was the bottleneck consuming most of the load time. Fixing the bigger problem first would have saved hours of work and delivered a better result immediately.
How to Diagnose Your Actual Problem
You don't need to be technical to figure this out. Here's a straightforward process:

Step 1: Measure Your TTFB
Run your site through a free speed test. Look specifically for the TTFB or "server response time" metric.
- Under 800ms: Your server is doing its job. Focus on page optimization.
- 800ms–1.5 seconds: Your server is sluggish. Likely a caching issue or an overloaded shared host.
- Over 1.5 seconds: Your server is a significant bottleneck. Hosting changes will likely have the biggest impact.
Step 2: Check Your Total Page Weight
While you're looking at speed test results, note the total page size and the number of requests.
- Under 2MB total, under 50 requests: Reasonably lean. A slow load here points toward server issues.
- 2–5MB total or 50–100 requests: Room for optimization. Both hosting and optimization could be factors.
- Over 5MB or over 100 requests: Your page is heavy. Optimization should be a priority regardless of hosting.
Step 3: Compare TTFB to Total Load Time
This is the key diagnostic step. Calculate what percentage of your total load time is TTFB.
- Over 40%: Hosting is your primary problem.
- Under 20%: Optimization is your primary problem.
- Between 20% and 40%: Both deserve attention.
Example: If your page loads in 5 seconds and TTFB is 2.5 seconds, that's 50%. Half your load time is the server just thinking about responding. No amount of image compression fixes that.
Quick Diagnostic Checklist
- [ ] Run a speed test and record the TTFB
- [ ] Record the total page load time
- [ ] Record the total page size in MB
- [ ] Divide TTFB by total load time to get the percentage
- [ ] Note how many HTTP requests the page makes
- [ ] Test from a location near your target audience
Fixing Hosting Problems
If your diagnosis points toward hosting, work through these fixes in order of effort and cost.
Enable Server-Side Caching
Before switching hosts, check whether caching is enabled. Many hosting providers offer server-level caching that's turned off by default.
For WordPress sites, this means a page caching plugin (WP Super Cache, W3 Total Cache, or your host's built-in option). For other platforms, check your hosting control panel for caching settings.
Server-side caching stores a pre-built copy of your page so the server doesn't rebuild it for every visitor. This alone can cut TTFB by 50–80% on dynamic sites.
Cost: Free. Time: 15 minutes.
Use a CDN
A Content Delivery Network stores copies of your site on servers around the world. When someone in London visits your site, they get the page from a nearby server instead of waiting for a response from Virginia.
Cloudflare offers a free tier that works with most hosting providers. Setup typically takes 30 minutes and involves changing your domain's nameservers.
Cost: Free to $20/month. Time: 30 minutes.
Upgrade Your Hosting Plan or Provider
If caching is enabled, you're using a CDN, and TTFB is still over 800ms, the hosting infrastructure itself is the bottleneck. Some budget hosts oversell their servers so aggressively that no amount of caching helps.
Start by upgrading your plan with your current host — you get more CPU, more memory, and fewer neighbors on your shared server. If that doesn't help, move to a managed host with better infrastructure (SiteGround, Cloudways, Kinsta, or similar).
Cost: $15–$50/month. Time: 1–3 hours for migration.
Fixing Optimization Problems
If your TTFB is healthy but your page is still slow, the problem is what you're sending to the browser.
Oversized Images
This is the single most common website performance problem. A 3000×2000 pixel photo displayed at 600×400 pixels is wasting 80% of its data. An uncompressed PNG screenshot that should be a JPEG can be 10x larger than necessary.
Fix: Resize images to actual display dimensions. Convert to WebP format. Use lazy loading so images below the fold don't load until the visitor scrolls.
Too Many Third-Party Scripts
Every chat widget, analytics tool, social media embed, and marketing pixel adds JavaScript that the browser must download and execute. Five third-party scripts can easily add 1–2 seconds to your load time.
Fix: Audit what's running on your page. Remove anything you're not actively using. Defer scripts that aren't needed for the initial page render.
Render-Blocking CSS and JavaScript
Some resources block the browser from displaying anything until they're fully downloaded and processed. If your site loads a large CSS file and three JavaScript files before rendering content, visitors see a blank screen while all of that downloads.
Fix: Inline critical CSS (the styles needed for above-the-fold content) and defer everything else. Move non-essential scripts to the bottom of the page or load them with the async or defer attributes.
Missing Browser Cache Headers
Without proper cache headers, returning visitors download everything from scratch on every visit. Setting cache headers correctly means repeat visits load almost instantly because the browser reuses files it already has.
Fix: Configure Cache-Control headers for static assets (images, CSS, JS) with a max-age of at least 30 days. Your hosting provider's documentation will have specific instructions.
The Right Order of Operations
When your site is slow, fix things in this order:
- Measure TTFB first. If it's over 1.5 seconds, start with hosting fixes.
- Enable server-side caching. Free and takes minutes.
- Add a CDN if your audience is geographically distributed.
- Optimize page content: images, scripts, CSS, fonts.
- Upgrade hosting if caching and a CDN didn't bring TTFB under 800ms.
This order matters because each step changes what you should measure next. Fixing a hosting problem might make an optimization problem more visible, and vice versa.
What Google Actually Cares About
Google's Core Web Vitals include three metrics that directly affect search rankings:
- Largest Contentful Paint (LCP): How long until the main content is visible. Affected by both hosting and optimization. Google considers under 2.5 seconds "good."
- Interaction to Next Paint (INP): How responsive the page is when someone interacts with it. Mostly an optimization issue caused by heavy JavaScript.
- Cumulative Layout Shift (CLS): How much the page layout jumps around during loading. Purely an optimization issue.
A slow server hurts LCP directly. If the server takes 2 seconds to respond, your LCP can't possibly be under 2 seconds — you've already burned your entire budget on server response alone. Google has stated that helpful, accessible content is a ranking factor, but a page that takes five seconds to load isn't accessible in any practical sense.
When to Spend Money (and When Not To)
Don't spend on premium optimization plugins before you've checked your TTFB. A $50/year caching plugin won't fix a $4/month hosting problem.
Don't spend on expensive hosting if your page ships 8MB of uncompressed images. A fast server delivering a bloated page is still a slow experience.
Do spend on better hosting if your TTFB is consistently over 1 second and server-side caching hasn't fixed it. The difference between a $4/month host and a $25/month host is often the difference between a 3-second TTFB and a 300-millisecond TTFB.
Do spend on professional optimization help if your page weight is over 5MB and you don't know where to start — but only after you've confirmed hosting isn't the bottleneck.
Find Out What's Actually Slowing Your Site Down
The worst approach to website speed is guessing. The second worst is following generic advice without measuring your specific situation first.
Run a free audit with FreeSiteAudit to get a clear breakdown of your server response time, page weight, and specific performance issues. The report tells you whether your problem is hosting, optimization, or both — so you fix what actually matters instead of optimizing things that aren't broken.
It takes 30 seconds, costs nothing, and shows you exactly where your load time is going.

Sources
- https://web.dev/articles/vitals
- https://web.dev/articles/ttfb
- https://developers.google.com/search/docs/fundamentals/creating-helpful-content
Check your website for free
Get an instant score and your top 3 critical issues in under 60 seconds.
Get Your Free Audit →