How to Reduce Your Website's Total Blocking Time (Plain-English Guide)
A practical, jargon-light guide to reducing Total Blocking Time so your site feels fast, responds on the first tap, and stays usable for real visitors.
# How to Reduce Your Website's Total Blocking Time (Plain-English Guide)
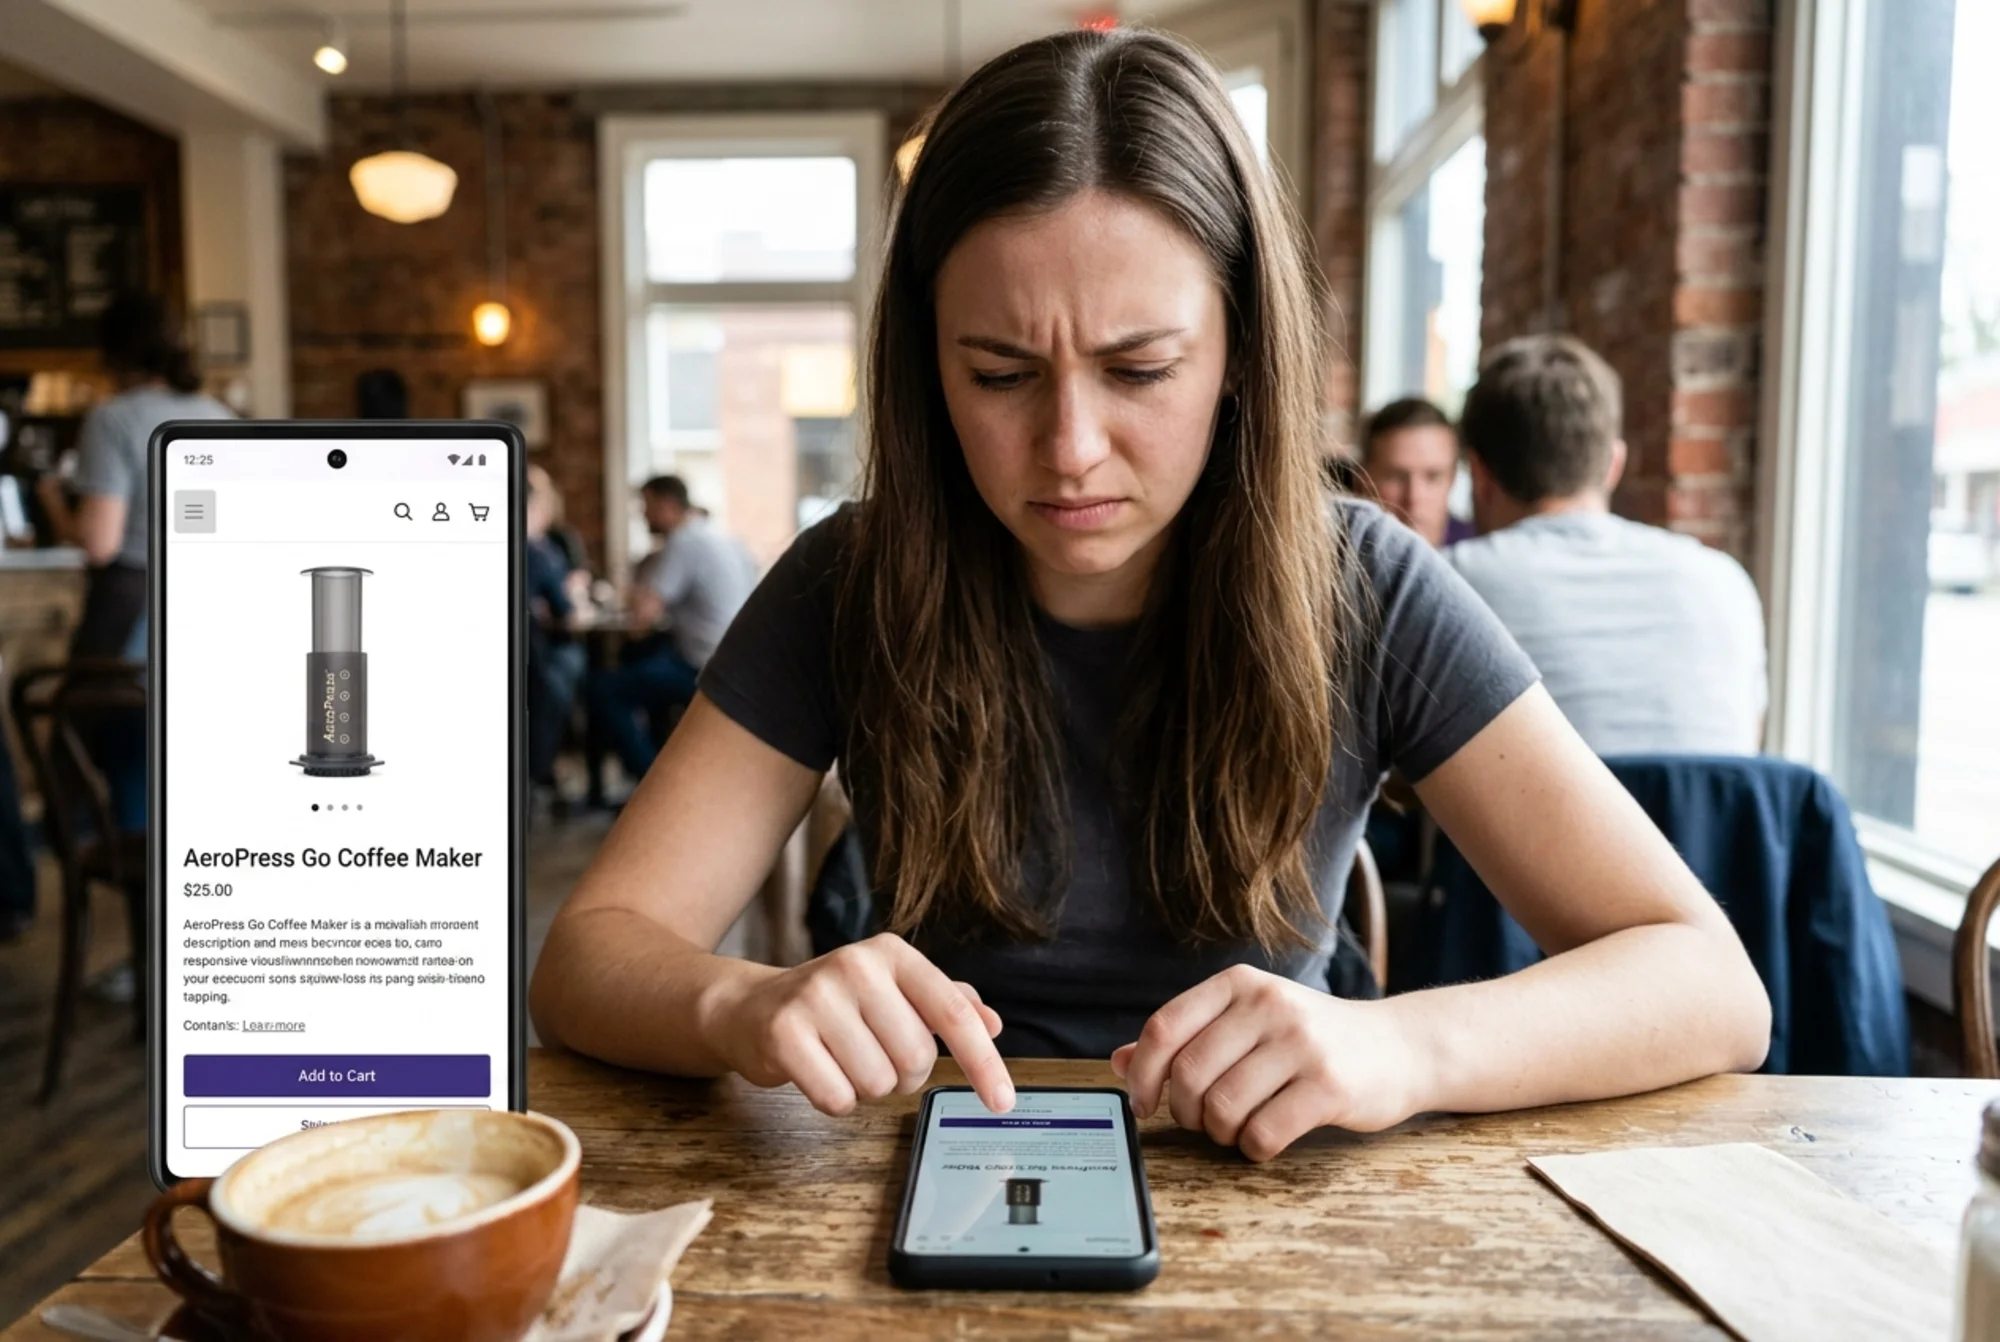
Your homepage looks loaded. The hero image is there. The headline is there. A visitor taps "Get a quote"... and nothing happens. A half-second later, the button works — but by then they've tapped twice or started scrolling.
That dead spot between "looks loaded" and "actually works" is what Total Blocking Time measures. It's one of the quietest performance problems on the web because the page looks fine in a screenshot. It's also one of the most common reasons people bounce from small business sites without converting.
This guide explains what Total Blocking Time (TBT) is, why it's usually bad on small business sites, and how to reduce it without rebuilding your site or hiring a performance consultant.

What Total Blocking Time really means
Every web page loads in two phases that most people lump together:
- Visual loading — the pixels show up. Images, text, layout.
- Interactive loading — the page becomes usable. Buttons respond. Menus open. Forms accept input.
Total Blocking Time measures the gap between those two phases. Specifically, it measures how much time during page load the browser was too busy running JavaScript to respond to a tap, click, or keystroke.
A "long task" is any block of JavaScript that runs for more than 50 milliseconds without pausing. TBT adds up the portion of every long task that exceeds that 50ms threshold. If a script runs for 200ms, it contributes 150ms to your TBT. Ten of those during load equals 1.5 seconds where your visitor's taps simply don't register.
Google's targets, in plain terms:
- Good: under 200ms of TBT
- Needs improvement: 200–600ms
- Poor: over 600ms
TBT is the lab-test cousin of Interaction to Next Paint (INP), the Core Web Vital Google uses for real-world responsiveness. If your TBT is high in PageSpeed Insights or Lighthouse, your INP is almost certainly suffering for real users too.
Why small business sites are especially prone to high TBT
Most TBT problems on small business sites don't come from custom code. They come from things added one at a time, each one seemingly harmless:
- A chat widget
- A cookie banner
- A heatmap or session-recording script
- Two or three analytics tools
- A Facebook Pixel and a TikTok Pixel
- A reviews carousel
- A page builder that ships ten plugins' worth of JavaScript whether you use them or not
Each one adds a layer of JavaScript that has to be parsed and executed before the page becomes interactive. Individually, each one is small. Stacked, they form a wall.
If your site runs on WordPress, Shopify, Wix, or Squarespace, this stacking effect is the single most common cause of poor TBT scores.
How to measure your TBT (the five-minute version)
Before you fix anything, get a baseline so you can confirm your changes actually helped.
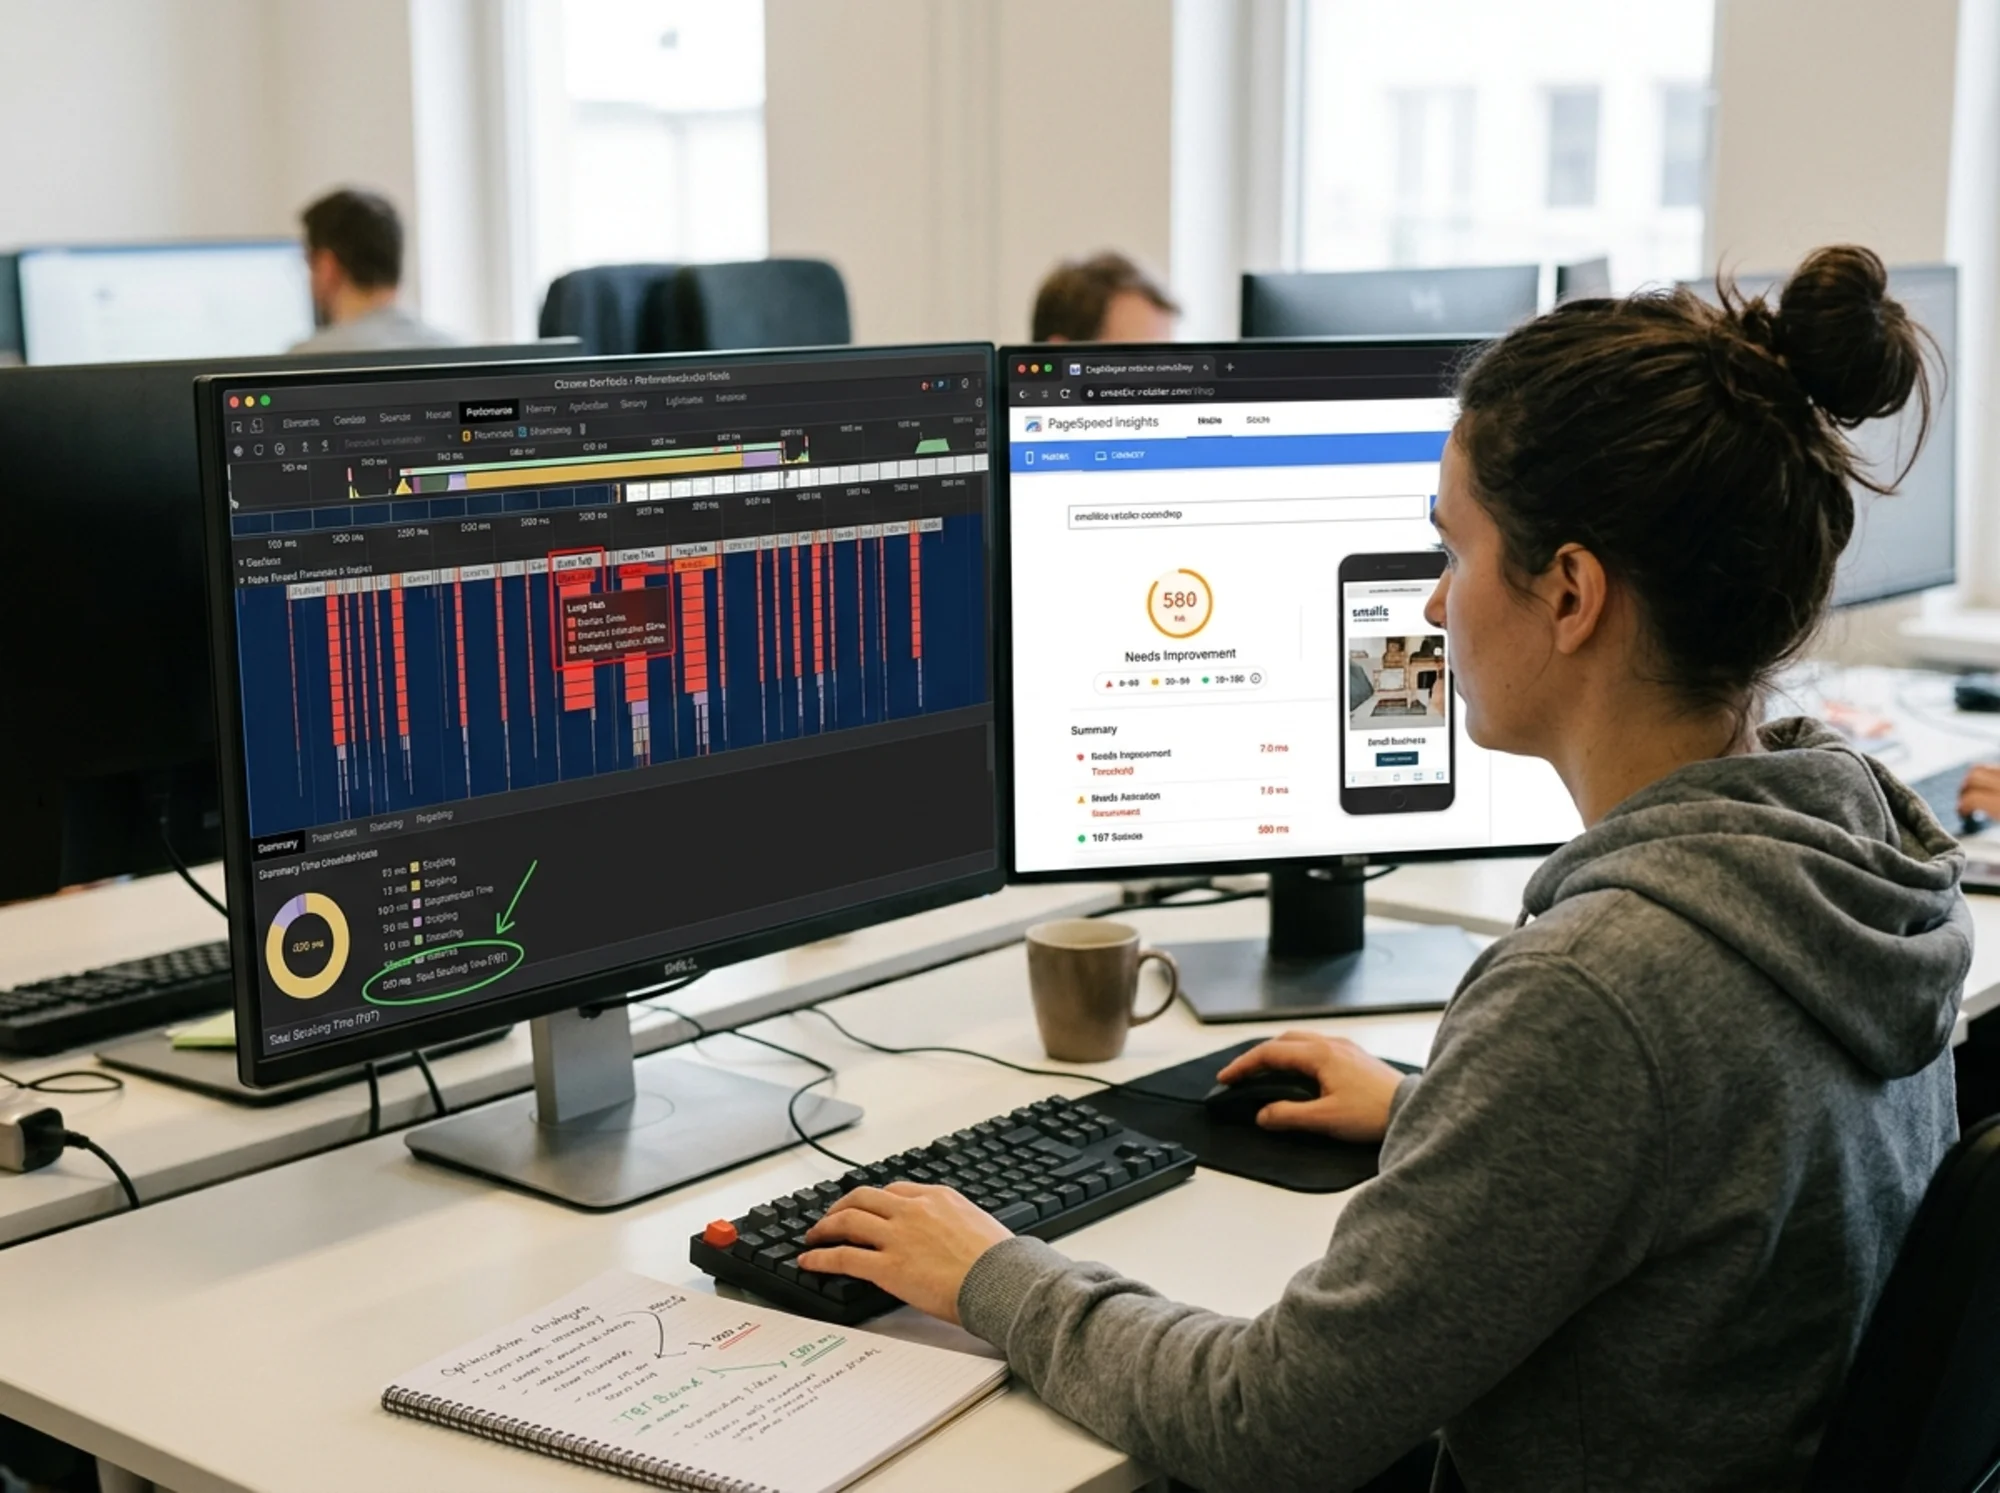
- Run your URL through PageSpeed Insights, or use a free audit tool like FreeSiteAudit.
- Test your homepage and at least one product/service page — they often have very different TBT.
- Look at the Mobile tab, not desktop. Mobile is where TBT bites hardest because phones have slower processors than laptops.
- Write down the TBT number and screenshot the "Diagnostics" section. That section lists which scripts are causing long tasks.
- Retest at a different time of day if you can — third-party scripts can vary in response time.
If the report calls out specific scripts by name (Google Tag Manager, hotjar.com, intercom.io, a theme JS file), those are your suspects.
A specific walkthrough: from 1,140ms to 280ms
Here's a realistic scenario. A handmade jewelry shop on Shopify gets this PageSpeed mobile report:
- TBT: 1,140ms (Poor)
- Diagnostics flags: Klaviyo, a reviews app, a currency converter, Google Tag Manager (4 tags), and the theme's main JS bundle.
The owner isn't a developer. Here's the order they work in:
Step 1: Audit what's installed. They open their Shopify apps list and find a wishlist app installed for a campaign two years ago — still loading scripts on every page. Uninstalled.
Step 2: Defer the reviews widget. The reviews carousel sits halfway down the product page. There's no reason it needs to load before the page is interactive. They switch the app's loading mode from "page load" to "after interaction" in the app settings.
Step 3: Clean up Google Tag Manager. Four tags fire on every page. Two are legacy: an old Bing Ads pixel from a paused campaign and a duplicate GA4 tag installed by someone who didn't realize Shopify already had GA4 native. Both paused inside GTM.
Step 4: Delay the chat widget. Klaviyo's onsite chat is set to load immediately. They switch it to load after 5 seconds or on first user interaction.
Step 5: Re-test. TBT: 280ms. Still "needs improvement," but no longer poor — and interactive elements now respond within a normal range. The site visually loads in the same time as before, but visitors can actually use it sooner.
Note what didn't happen: they didn't change their theme, didn't hire a developer, and didn't touch any code. They removed and rescheduled scripts.
The TBT reduction checklist
Use this as a working order. Do them top-to-bottom, re-test after each batch, and stop when you hit your target.
Layer 1: Remove what you don't need
- List every third-party tool loading on your site (chat, analytics, pixels, popups, reviews, heatmaps, A/B testing).
- For each one, ask: "Has anyone looked at the data from this in the last 90 days?" If no, remove it.
- Remove duplicate analytics installations (very common after switching themes or installing all-in-one SEO plugins).
- Disable unused plugins on WordPress. Deactivated is not enough — uninstall.
Layer 2: Delay what isn't needed at first paint
- Chat widgets: load after 3–5 seconds or on first scroll/click.
- Reviews widgets, social embeds, Instagram feeds: lazy-load when scrolled into view.
- Tracking pixels (Facebook, TikTok, Pinterest): move into Google Tag Manager with a "Window Loaded" trigger instead of "Page View."
- Cookie banners: keep the consent prompt fast, but defer any analytics that should only fire after consent.
Layer 3: Trim what stays
- Audit the tags inside Google Tag Manager. Remove anything for paused campaigns or retired tools.
- Check your theme's JS bundle. Some Shopify themes ship "compare," "quick view," and "currency switcher" features that load even if you don't use them. Many themes have toggles to disable them.
- On WordPress, use a plugin like Asset CleanUp or Perfmatters to stop specific plugins from loading on pages where they aren't needed (e.g., a contact form plugin loading on every blog post).
- Replace large client-side libraries with lighter alternatives where possible.
Layer 4: Help the browser do less at once
- Add
asyncordeferattributes to non-critical scripts so they don't block parsing. Most modern themes do this automatically; older themes don't. - Self-host fonts instead of pulling them from Google Fonts CDN where possible — fewer connection round-trips.
- Avoid loading the same large library twice. This happens often when a theme and a plugin each ship their own copy of jQuery or a slider library.
Platform-specific notes
WordPress
The biggest wins usually come from auditing plugins and choosing a lighter theme. Page builders like Elementor and Divi are powerful but ship JavaScript for features you don't use. Many have "performance" or "experiments" sections — turn on "Optimized DOM Output" and "Lazy Load Background Images" if they exist.
If you use a caching plugin, make sure it's set to combine and defer non-critical CSS/JS. WP Rocket, FlyingPress, and LiteSpeed Cache all have settings for this.
Shopify
Apps are the usual culprit. Open your installed apps list and ask, for each one, whether you're actively using it. Removing an app fully (not just hiding it) removes its scripts. For apps you keep, check if they offer a load mode — many newer apps let you choose between immediate, lazy, or on-interaction.
Some themes ship optional features like "Color Swatches" or "Predictive Search" that add JavaScript weight. Disabling unused features in theme settings can help.
Wix and Squarespace
You have less direct control on these platforms, but you can still:
- Remove unused apps and integrations from the marketplace.
- Avoid stacking custom code snippets in the header — consolidate where possible.
- Disable animations on mobile if your platform allows it; many "fancy" effects rely on JavaScript that runs during load.
Custom or framework-based sites
This is where a developer can make real progress: code splitting, server-side rendering, removing unused dependencies, replacing heavy libraries, and using web workers for non-critical work. Brief a developer with your PageSpeed report and your TBT diagnostics, and they'll have a clear starting list.
What to avoid
A few things look like fixes but aren't:
- Adding more plugins to "speed up" your site. Each "optimization" plugin runs JavaScript of its own. Test before and after.
- Turning off analytics entirely. You need data. The goal is to delay tracking until after the page is interactive, not to remove it.
- Switching themes hoping for magic. A new theme can help, but it can also reintroduce the same JS bloat with a new face. Audit the theme's JS payload before switching.
- Chasing the score, not the experience. PageSpeed Insights is a guide. The real test is: tap a button on your phone one second after the page appears. Does it respond?
How long should this take?
For most small business sites, a focused afternoon of audit and pruning will move TBT noticeably. A second pass two weeks later, after watching real-user data, usually closes the gap.
Don't expect to hit "Good" on the first try. A realistic first goal is to leave the "Poor" band and reach "Needs Improvement." From there, each round of cleanup yields smaller but worthwhile gains.

Why this matters beyond the score
TBT maps directly to whether a real human can use your site in the first few seconds after it appears. Those first seconds are when most visitors decide whether to keep going or leave.
For an e-commerce site, that's the difference between "added to cart" and "back to Google." For a service business, it's whether the "Book a call" button works on the first tap or the fifth. For content sites, it's whether the menu opens before the reader gives up.
Google treats page experience — including responsiveness — as part of how it evaluates helpful content. But more importantly, your visitors evaluate responsiveness whether Google does or not. Every tap that misses is a small frustration, and small frustrations compound.
Run a free audit and find your TBT issues
If you don't already know your site's Total Blocking Time, the fastest way to start is to run a free audit. FreeSiteAudit gives you your TBT score on mobile and desktop, flags the specific scripts causing long tasks, and tells you in plain English which ones to defer, remove, or replace.
You don't need to be technical, and you don't need to fix everything in one sitting. Start with the worst offender, ship the change, re-test, and move on. Most small business sites can move from "Poor" to "Good" in three or four focused rounds — no rebuild required.
Sources
- https://web.dev/articles/vitals
- https://developers.google.com/search/docs/fundamentals/creating-helpful-content
Check your website for free
Get an instant score and your top 3 critical issues in under 60 seconds.
Get Your Free Audit →