How to Use Lighthouse for a Complete Site Audit
A plain-English guide to running Google Lighthouse for a complete site audit: performance, SEO, accessibility, Core Web Vitals, and what to fix first.
# How to Use Lighthouse for a Complete Site Audit
If you run a small business website, you have probably heard someone mention "your Lighthouse score" the way a mechanic mentions your oil level — important-sounding, vaguely technical, easy to ignore. But Lighthouse is genuinely useful, completely free, and built right into the browser you are probably reading this in.
This guide covers what Lighthouse actually checks, how to run it, and how to turn the results into a short list of fixes a developer (or you, on a slow afternoon) can actually do.
What Lighthouse Is, in Plain English
Lighthouse is a free auditing tool made by Google. It loads your page the way a visitor would, then grades it across four categories:
- Performance — how fast the page loads and becomes usable
- Accessibility — how well people with disabilities can use it
- Best Practices — modern web hygiene (HTTPS, secure libraries, no console errors)
- SEO — basic things search engines need to understand the page
Each category scores 0–100. Green is 90+, orange is 50–89, red is below 50. Most small business sites land in orange on the first run, and that is normal.
Lighthouse audits one URL at a time. That sounds limiting, but it is a feature: most problems repeat across pages, so fixing one template fixes hundreds of URLs.
Why Small Business Owners Should Care
1. Page experience is a ranking signal. Core Web Vitals — the speed and stability metrics Lighthouse measures — are real Google ranking factors. A slow, jumpy page can lose to a faster competitor even when your content is better.
2. Speed converts. When a page takes more than three seconds to load, a meaningful chunk of visitors leave before they see your offer. That is revenue you paid for through ads or SEO and dropped on the floor.
3. Accessibility issues are legal exposure. US businesses have been sued under the ADA for inaccessible websites. Lighthouse catches the most common offenders before they become a lawyer's discovery exhibit.
How to Run Lighthouse (Three Ways)
Option 1: Chrome DevTools
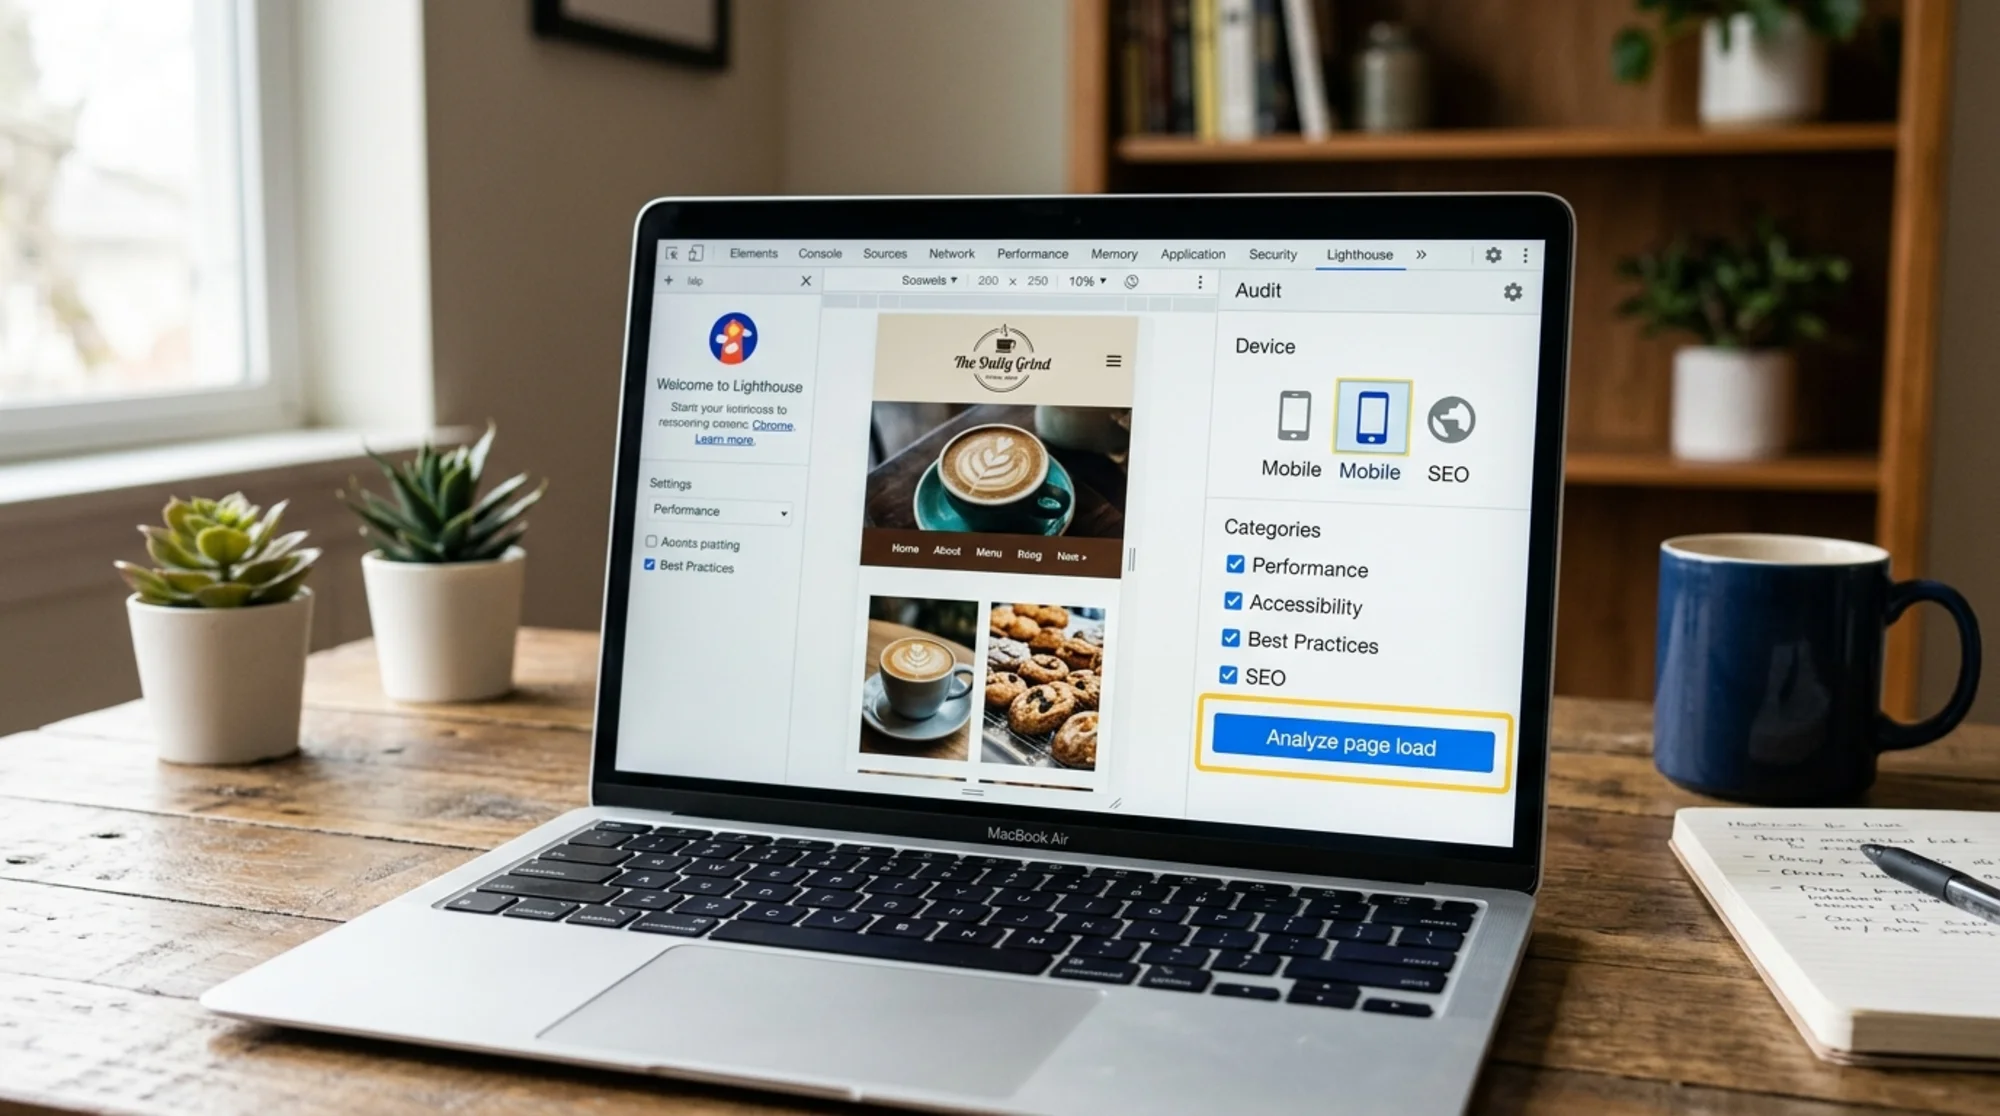
- Open your site in Google Chrome (use incognito — extensions skew results)
- Right-click anywhere and choose Inspect
- In the panel that opens, click the Lighthouse tab (you may need the
>>overflow) - Leave all categories checked for the first run
- Choose Mobile — Google's index is mobile-first
- Click Analyze page load
Wait 30–60 seconds. Do not click around while it runs.
Option 2: PageSpeed Insights
If DevTools feels intimidating, go to pagespeed.web.dev, paste your URL, hit Analyze. Same Lighthouse report, plus real-world performance data from actual Chrome users ("field data").
Option 3: A site-wide audit tool
Lighthouse handles one URL at a time. If you want every page on your site checked automatically, with results tracked over time and translated for a non-developer, that is what tools like FreeSiteAudit are for — they wrap Lighthouse-style checks around your entire site and produce a plain-English fix list.
What to Audit First
Do not start with your homepage. Start with the pages that make you money:
- The page people land on from Google ads (usually a service or product page)
- Your top organic landing page (check Search Console)
- Your checkout, contact form, or booking page
- Your homepage
- A representative blog post
If those five are healthy, the rest of your site usually is too.
Reading Your First Report Without Panicking
The four scores at the top
Useful as a snapshot, not for fixes. Scroll past.
The metrics section (Performance only)
This is where it gets useful. Six metrics, three of which Google actually uses for ranking — the Core Web Vitals, documented on web.dev/vitals:
- First Contentful Paint (FCP) — when something first appears
- Largest Contentful Paint (LCP) — when the main content is visible (Core Web Vital)
- Total Blocking Time (TBT) — how long the page freezes while loading
- Cumulative Layout Shift (CLS) — how much things jump around as it loads (Core Web Vital)
- Speed Index — overall visual loading speed
- Interaction to Next Paint (INP) — how fast the page responds to clicks (Core Web Vital)
If you fix nothing else, fix LCP, CLS, and INP.
Opportunities
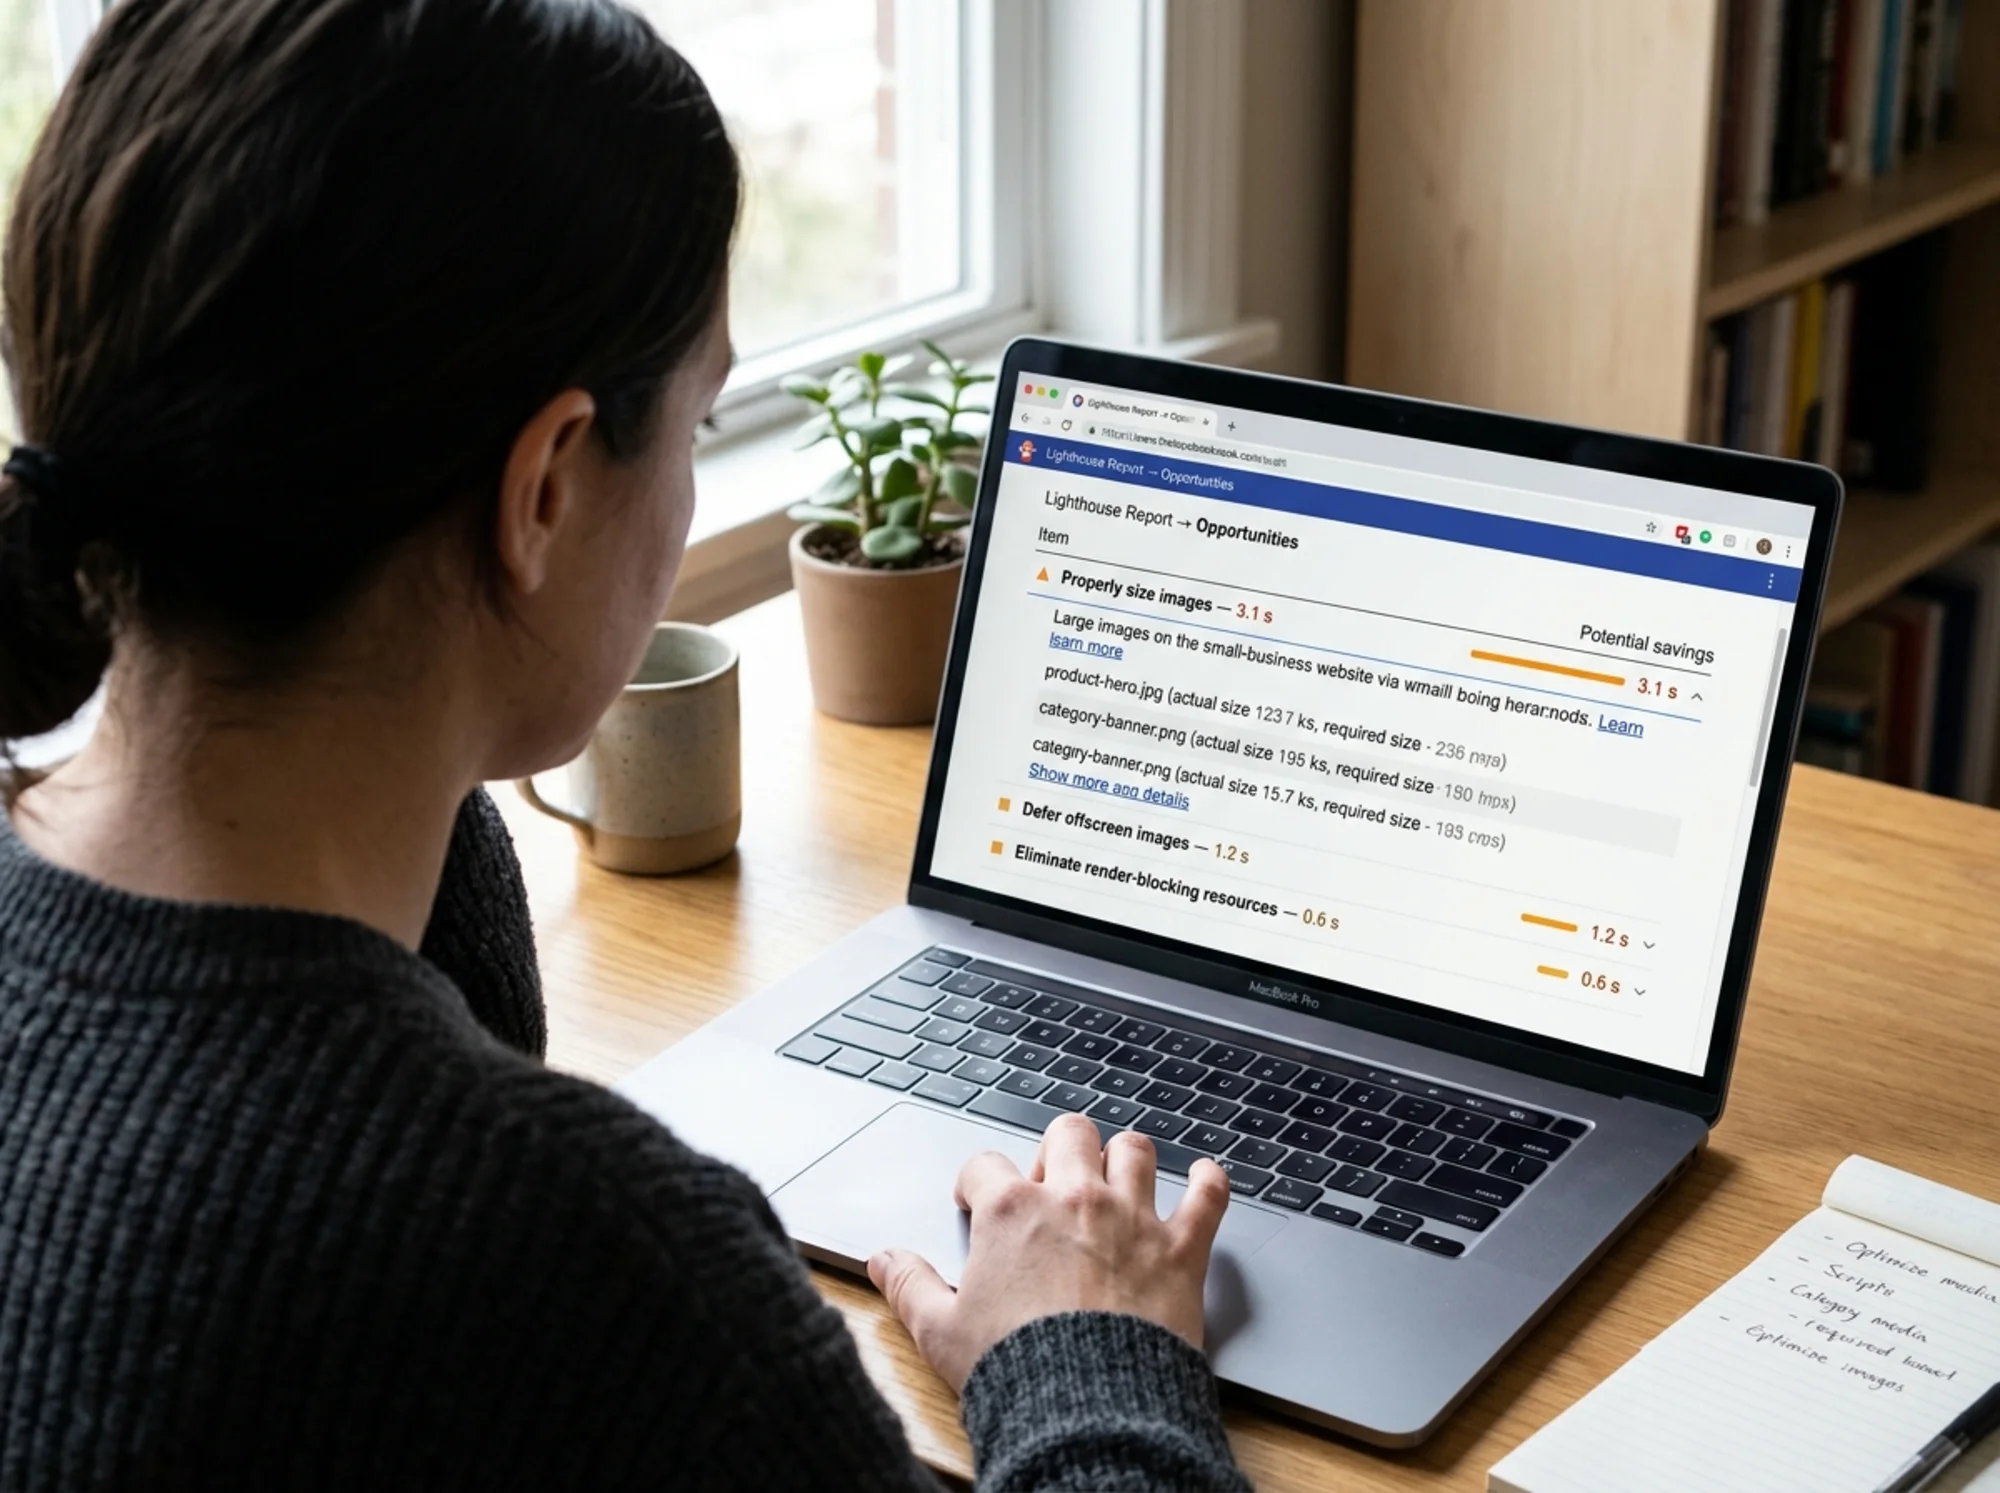
The gold. Lighthouse lists every specific change that would speed up your page, with estimated time savings next to each — for example:
- Properly size images — Est savings: 2.4 s
- Eliminate render-blocking resources — Est savings: 0.8 s
- Serve images in next-gen formats — Est savings: 1.1 s
Sort by estimated savings. Work top-down.
Diagnostics
Things that aren't slowing your page today but might. Worth a glance, not a panic.
A Real Walkthrough: A Local Bakery's Service Page
Say you run a small bakery and audit your "Custom Cakes" page. Here's what a realistic first report might look like.
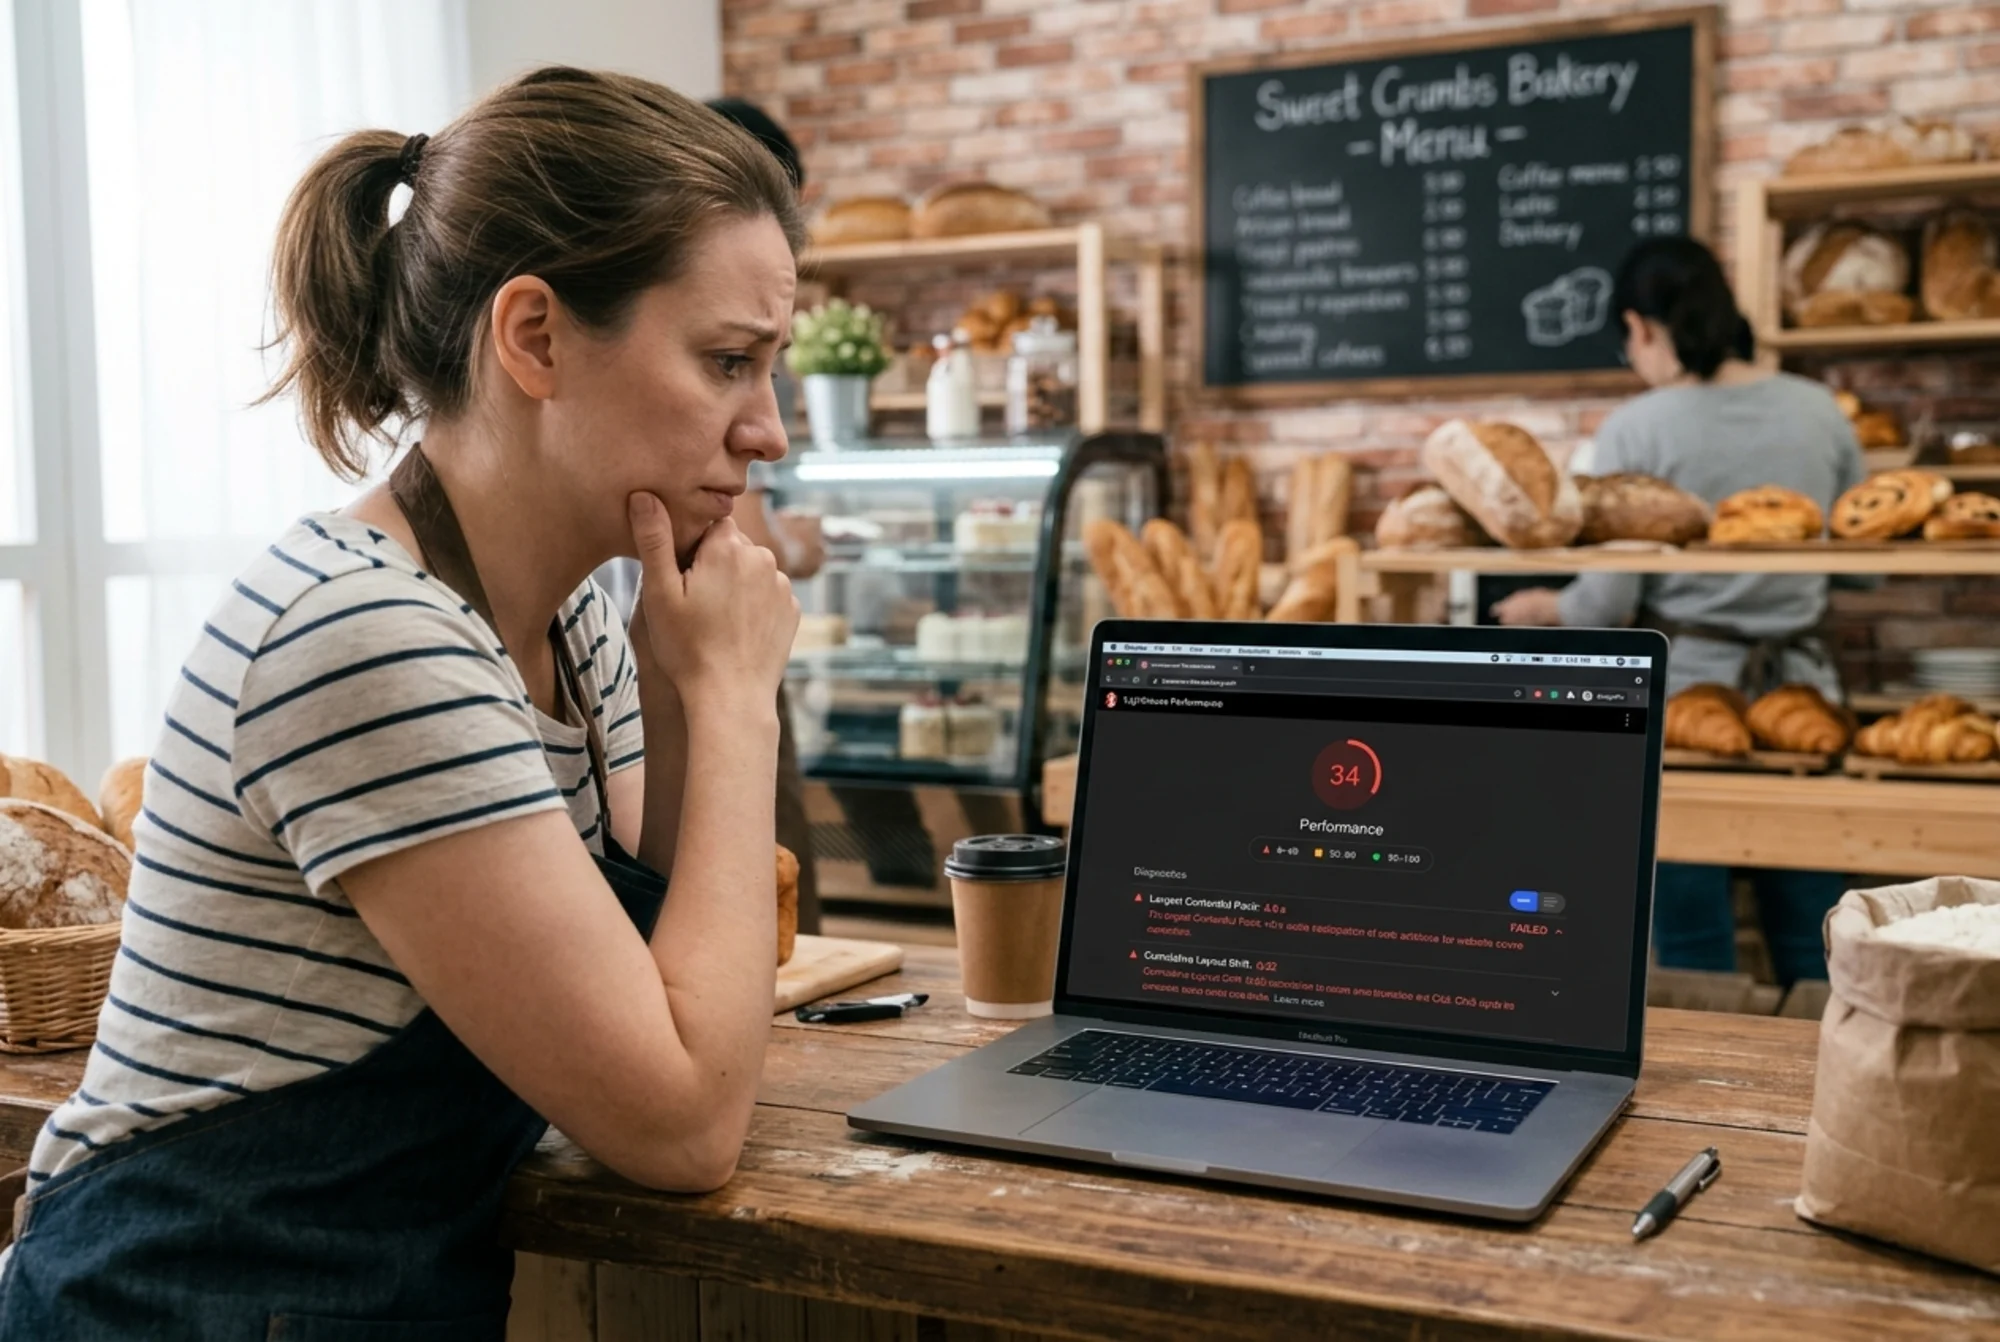
Performance: 41 (red)
- LCP: 4.8 s (poor — should be under 2.5)
- CLS: 0.32 (poor — should be under 0.1)
- INP: 220 ms (needs improvement — should be under 200)
Top Opportunities:
- Properly size images — 3.1 s savings
- Defer offscreen images — 1.2 s savings
- Eliminate render-blocking resources — 0.6 s savings
Top Diagnostics:
- Image elements do not have explicit
widthandheight - Avoid an excessive DOM size (1,840 elements)
Accessibility: 78
- Buttons missing accessible names (the heart-icon "favorite" button)
- Image elements missing
[alt]attributes (your cake gallery)
SEO: 92
- Document does not have a meta description
What you would actually do
- Compress and resize your cake photos. Your hero image is probably a 3 MB phone photo displayed at 600 pixels wide. Resize to the actual display size and save as WebP. This one fix often jumps performance scores by 20+ points. (See /fixes/largest-contentful-paint.)
- Add
widthandheightto images. This tells the browser how much space to reserve, stopping the page from jumping as images load — fixing CLS. (Walkthrough at /fixes/cumulative-layout-shift.)
- Add alt text to your cake gallery. Describe each cake briefly: "Three-tier wedding cake with white buttercream and fresh peonies." Helps screen readers and Google Image search.
- Write a meta description. One sentence, ~150 characters, describing the page. Most CMS platforms have a field for this in page settings.
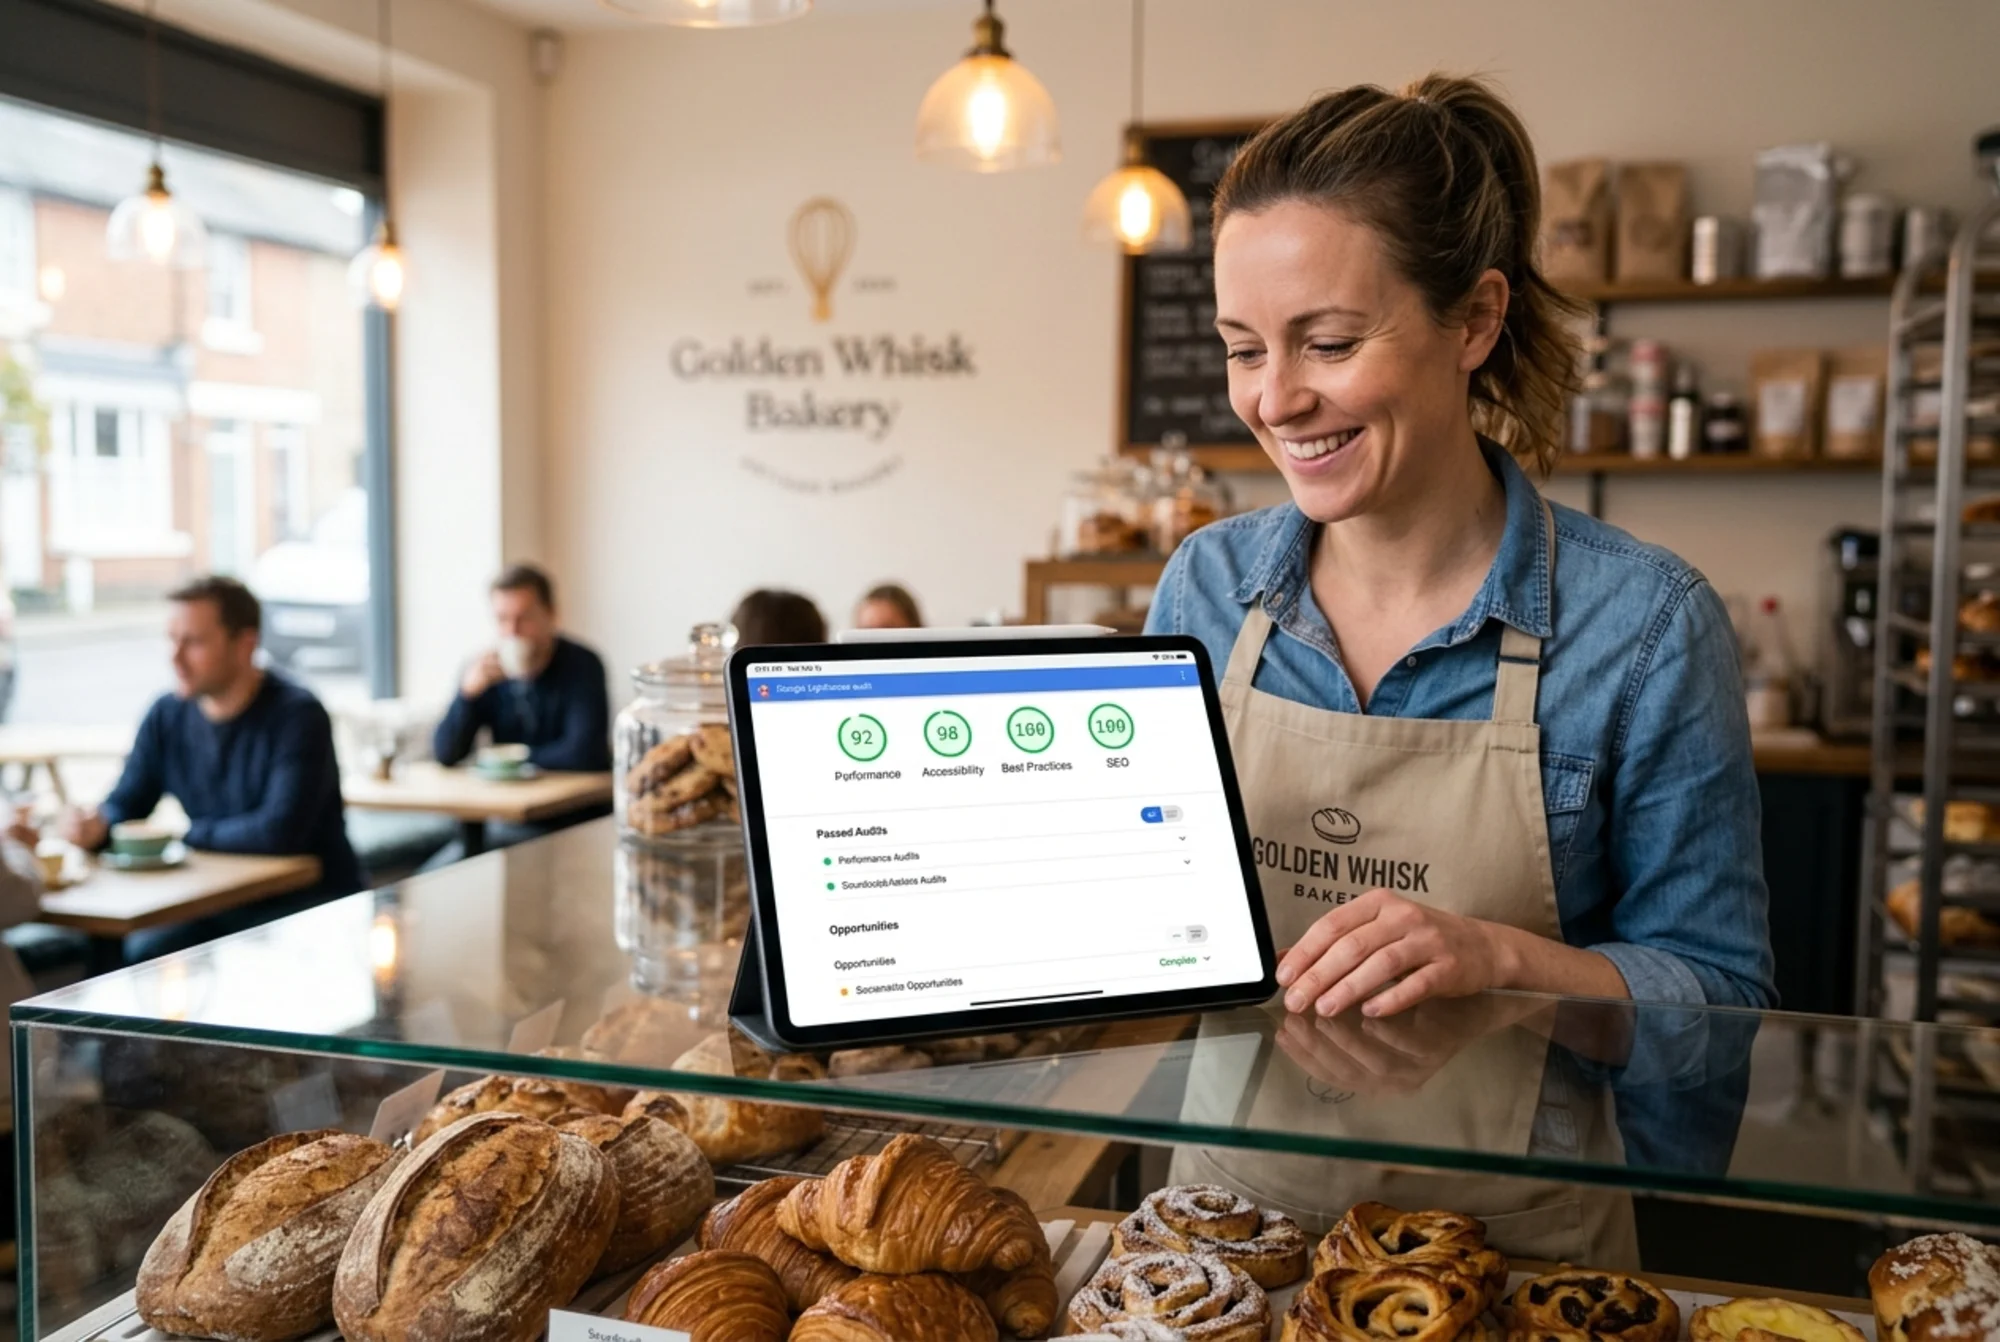
About half a day of work — enough to push scores from red to green across the board.
Common Issues and What They Actually Mean
"Properly size images" — Your images are bigger than they need to be. A 4000-pixel-wide photo shown at 800 pixels wastes bandwidth.
"Serve images in next-gen formats" — Use WebP or AVIF instead of JPEG/PNG. Most image tools can export these. Saves 25–50% file size with no visible quality loss.
"Eliminate render-blocking resources" — Some scripts or stylesheets are loading before the page can show anything. Usually fixed by adding async or defer to script tags, or inlining critical CSS. Usually needs a developer.
"Reduce unused JavaScript" — You're loading code the page doesn't need. Common culprits: chat widgets, analytics tools, social share buttons, themes with features you don't use.
"Avoid an excessive DOM size" — Your page has too many HTML elements. Often caused by page builders that wrap everything in five layers of "Largest Contentful Paint element" — Lighthouse names the specific slow element. Usually a hero image or a big text block. Optimize that element first. "Cumulative Layout Shift" — Things jump around as the page loads. Common causes: images without dimensions, ads, embedded videos, web fonts. Reserve space for them. Lighthouse has blind spots. It won't catch: For these, you need Search Console, real user monitoring, or a broader site audit tool. One solid afternoon. It moves the needle. Re-audit after every meaningful change. New theme, new plugin, new hero image — re-run Lighthouse. Catching a regression immediately beats discovering it three months later. Audit a sample of pages monthly. Three to five page types (homepage, service page, blog post, checkout). Trends matter more than single scores. Watch your field data. PageSpeed Insights shows real Chrome user data over the last 28 days. That is what Google uses for ranking. Your DevTools score is a forecast; field data is the weather. Don't chase 100. A perfect Performance score often requires tradeoffs (no chat widget, no analytics, no ads) that don't make sense for a business. Aim for green (90+); accept orange where there's a valid reason. Lighthouse is the right tool for spot-checking a page. It is the wrong tool for monitoring a whole site. If you have more than a dozen pages, or you don't have time to run audits manually, or you want issues translated into a fix list instead of a metric report — that's when an automated audit tool earns its keep. Run a free site-wide audit with FreeSiteAudit — we crawl your site, run Lighthouse-style checks against every page, and hand you a prioritized list of fixes in plain English. No credit card, no technical setup. Especially useful for ecommerce sites with hundreds of product pages where running Lighthouse manually isn't realistic. Lighthouse is free, built into Chrome, and tells you what's actually wrong with your page in measurable terms. Run it on your most important pages, focus on Core Web Vitals and the top three Opportunities, ignore score-chasing for its own sake. Fix what affects real users and real revenue, ship the changes, re-audit. That's the whole loop. You don't need to be a developer to start. You just need to open Chrome. Get an instant score and your top 3 critical issues in under 60 seconds.What Lighthouse Won't Tell You
A Mini-Checklist for Your First Audit
After the Audit: What Comes Next
When You Need More Than Lighthouse
The Short Version
Sources
Check your website for free