Largest Contentful Paint: Fixes That Actually Move the Metric
Diagnose slow LCP with real data, then apply five targeted fixes—image optimization, server response, render-blocking resources—that measurably improve Core Web
# Largest Contentful Paint: Fixes That Actually Move the Metric
Your website loads slowly. You know it, your visitors know it, and Google knows it. But most advice about fixing it is written for engineers, not business owners.
This guide focuses on Largest Contentful Paint — the single most important speed metric Google measures — and walks through five specific fixes that make a real difference. No filler. No theoretical optimizations that save 12 milliseconds. Just changes that move your LCP from red to green.
What Is Largest Contentful Paint?
Largest Contentful Paint (LCP) measures how long it takes for the biggest visible element on your page to fully load. That is usually your hero image, a large banner, or sometimes a big block of text.
Google considers LCP one of its three Core Web Vitals — the metrics it uses to evaluate page experience. The other two are Interaction to Next Paint (INP), which measures responsiveness when someone clicks or taps, and Cumulative Layout Shift (CLS), which measures visual stability. Of the three, LCP has the strongest correlation with real-world bounce rates because it directly determines how long visitors stare at a blank or half-loaded screen.
Here is what the LCP thresholds mean:
- Good: 2.5 seconds or faster
- Needs improvement: Between 2.5 and 4.0 seconds
- Poor: Slower than 4.0 seconds
These thresholds apply to the 75th percentile of page loads, meaning Google looks at how the experience is for most of your visitors, not just those on fast connections. If your LCP is over 4 seconds, Google classifies your page experience as poor, which affects your search rankings. It also affects whether real people stick around. Google's research shows that as page load time goes from 1 second to 3 seconds, the probability of a visitor bouncing increases by 32%. At 5 seconds, that jumps to 90%.
For a small business, every visitor counts. A landscaping company getting 500 organic visits per month with a 5-second LCP could be losing 450 of those visitors before they ever see a phone number.
Why LCP Matters More Than Overall Page Speed
You might already use terms like "page speed" loosely, but Google does not measure speed as a single number. LCP is specifically about perceived load speed — the moment a visitor feels the page is ready. A page might finish loading all its JavaScript and trackers at the 8-second mark, but if the hero image and headline are visible at 2 seconds, the LCP is 2 seconds. That is the number that counts.
This distinction matters because it changes where you invest your effort. Shaving 500 milliseconds off a tracking script that loads at the bottom of the page does nothing for LCP. Shaving 500 milliseconds off your hero image changes everything.
Google confirmed in its page experience documentation that Core Web Vitals are used as a ranking signal. Sites that pass all three vitals get a small but real ranking advantage over sites that fail them. For competitive local searches — "dentist near me," "plumber in Austin," "best coffee shop downtown" — that small advantage can mean the difference between appearing on page one and page two.
Step One: Identify Your LCP Element
Before you fix anything, you need to know what is slow. The LCP element is not always what you expect.
How to check:
- Go to PageSpeed Insights and enter your homepage URL
- Scroll to the Diagnostics section
- Find the entry labeled Largest Contentful Paint element — it tells you exactly which piece of content is the culprit
- Note whether the result is from lab data (simulated) or field data (real users) — field data is more reliable but requires enough traffic to generate a sample
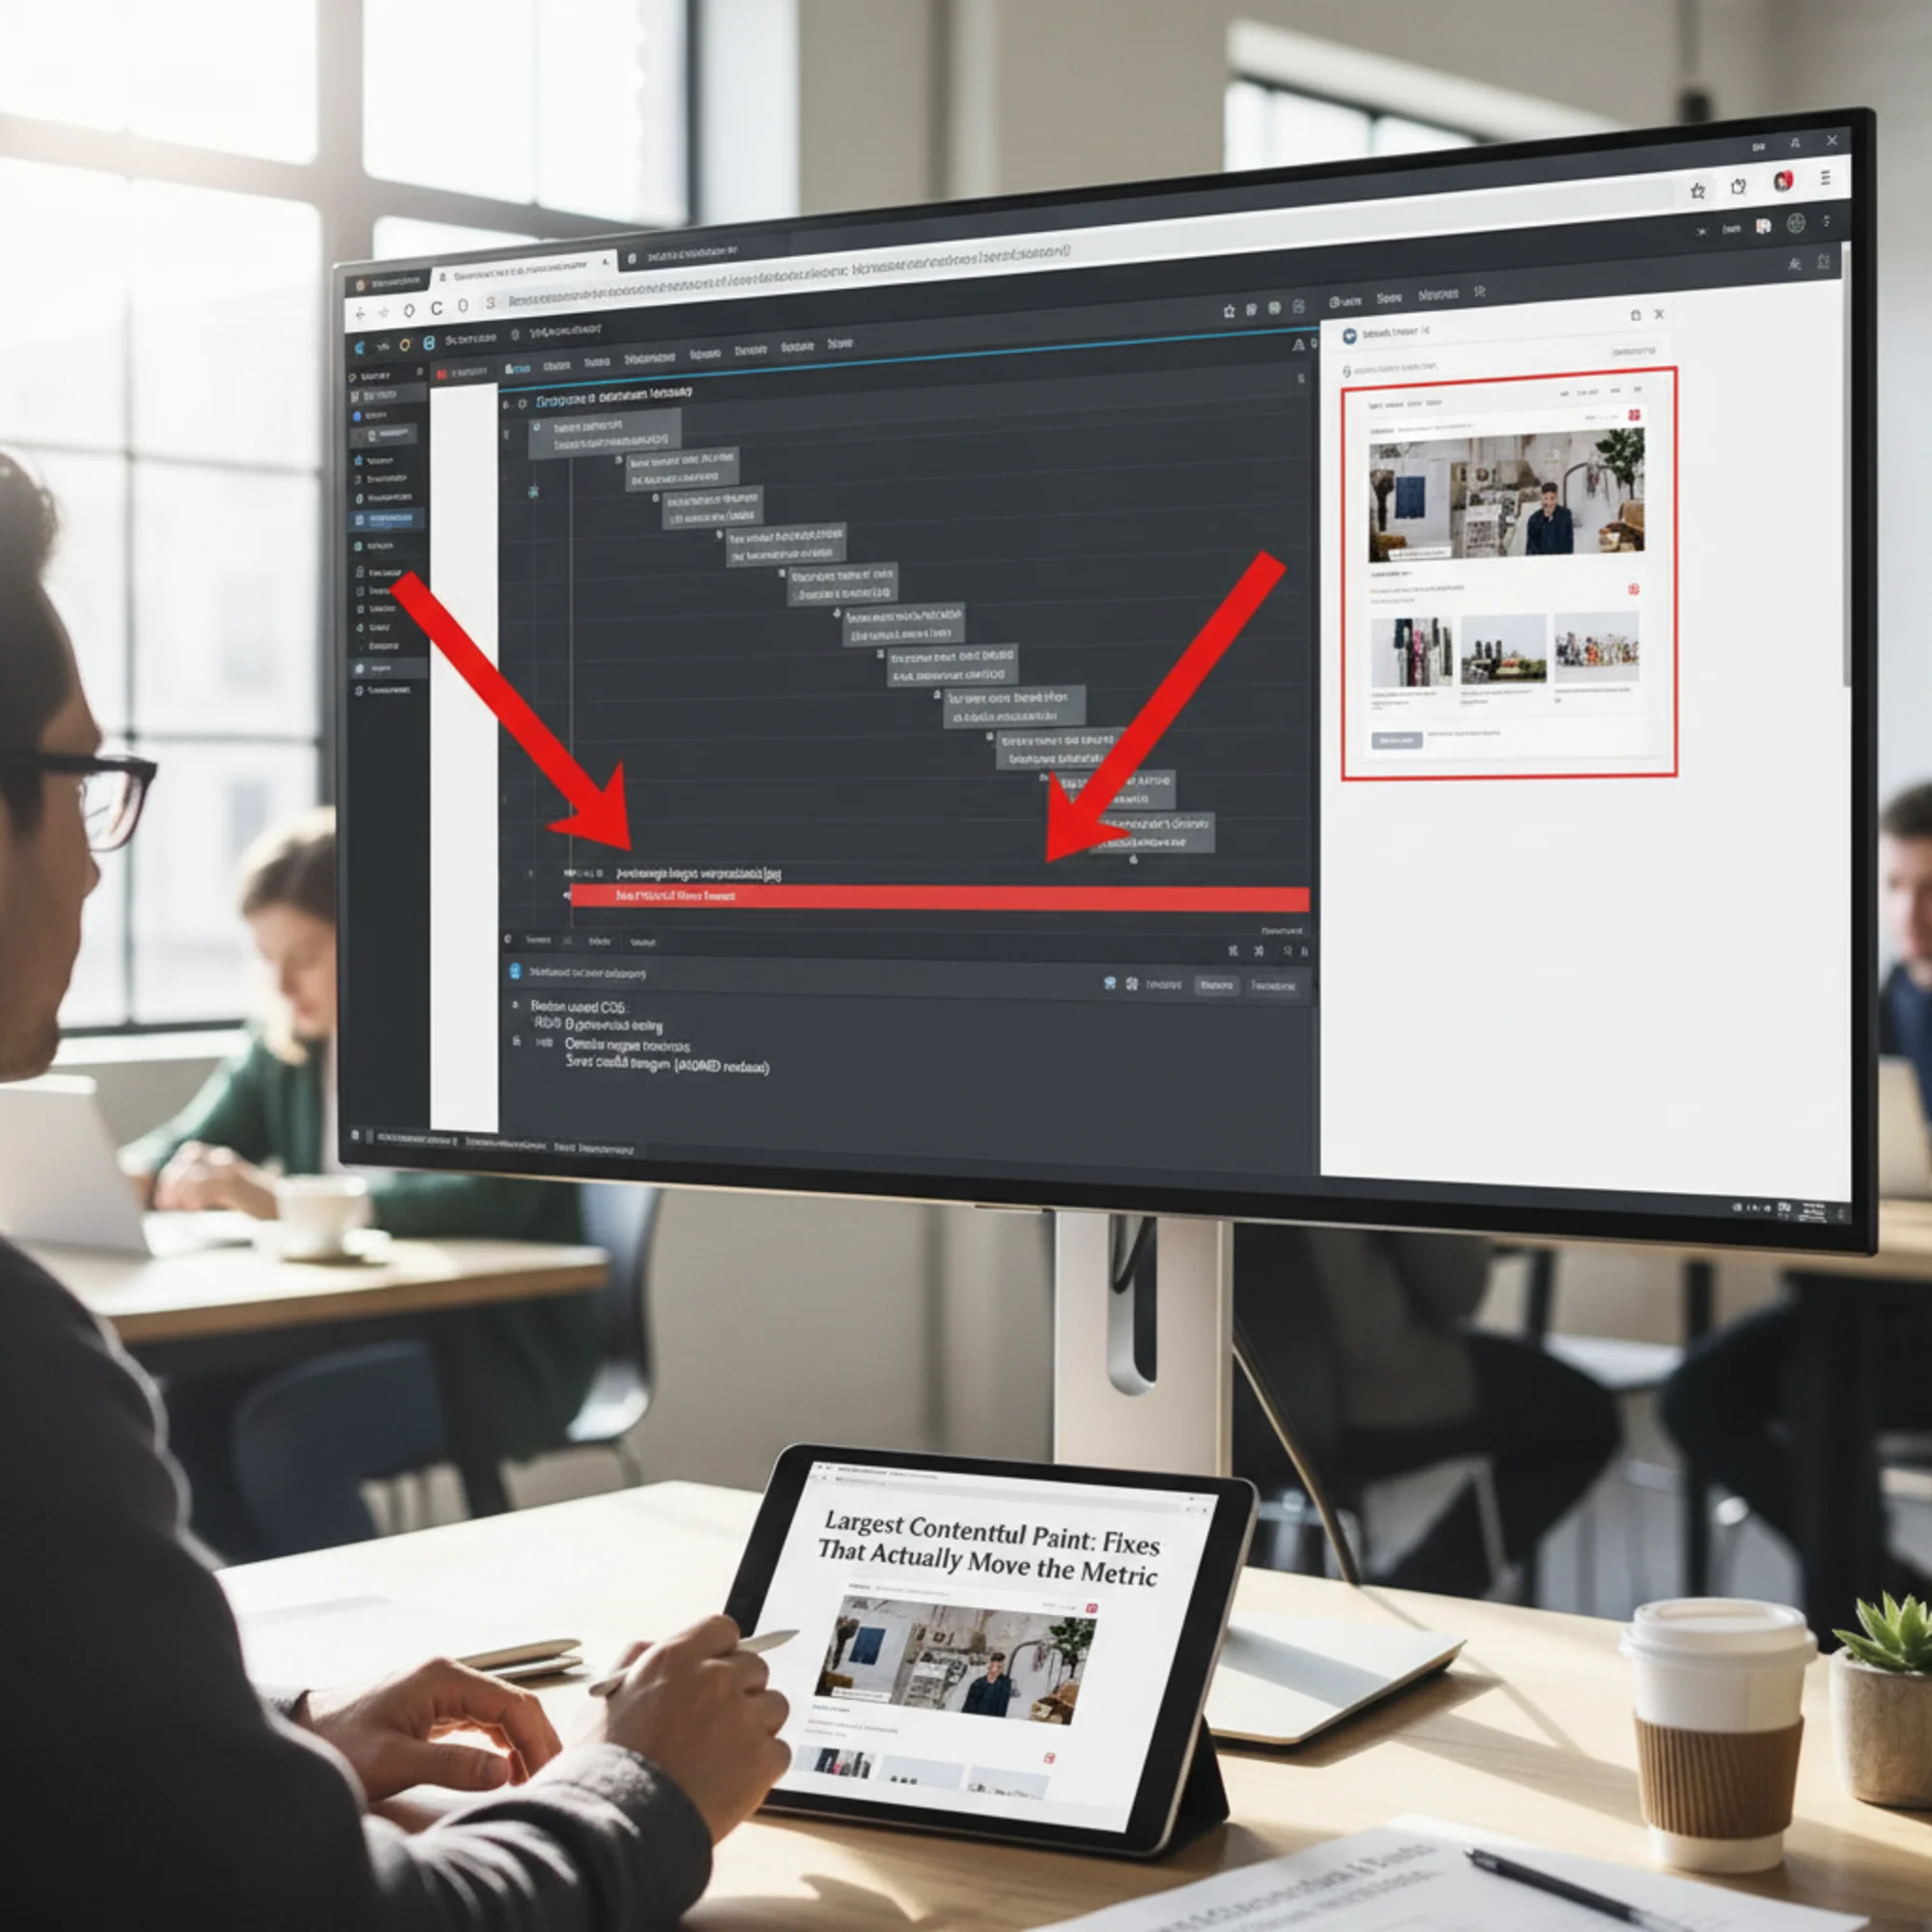
Alternative method using Chrome DevTools:
- Open your website in Chrome
- Press F12 to open DevTools
- Go to the Performance tab
- Click the reload button in the Performance panel
- After the recording finishes, look for the LCP marker in the timeline — hovering over it highlights the exact element on your page
Common LCP elements on small business sites:
- A hero image or banner across the top of the page
- A large background image behind your headline
- A product photo on a landing page
- A video poster image
- A large heading or text block (when no images load above the fold)
- A slideshow or carousel image (the first visible slide)
Write down what your LCP element is. Every fix below targets specific element types, so knowing yours saves you from irrelevant work.
The Five Fixes That Actually Work
Fix 1: Resize and Compress Your Hero Image
This is the highest-impact change for most small business websites. In our experience auditing hundreds of small business sites, an oversized hero image is the number one cause of poor LCP scores.
The problem: You uploaded a 4000×3000 pixel photo straight from your phone. Your website displays it at 1200×600 pixels. The browser still downloads the full-size file — often 2 to 5 megabytes — then shrinks it. That is like shipping a king-size mattress to furnish a twin bed.
The fix — step by step:
- Check your hero image dimensions (right-click the image → Inspect → note the rendered size in the box model display)
- Resize to match the displayed width plus 20% for sharp screens (1200px display = 1440px file). This ensures the image looks crisp on high-density displays like Retina screens without being wildly oversized
- Convert to WebP format (supported by all modern browsers including Chrome, Firefox, Safari, and Edge). WebP produces files 25 to 35% smaller than JPEG at the same visual quality
- Compress to 80% quality — visually identical to the original at normal viewing distance, dramatically smaller in file size
- Target a final file size under 200 KB for the hero image. Under 100 KB is even better
Free tool: Squoosh (squoosh.app) runs entirely in your browser with no signup required. Upload your image, select WebP as the output format, set quality to 80%, use the resize option to set your target width, and download the result. You can use the side-by-side comparison slider to verify there is no visible quality loss.
For WordPress users: If you want to automate this for all future uploads, install ShortPixel or Imagify. Both automatically compress and convert images to WebP when you upload them to the media library. Set the compression level to "lossy" and the maximum width to 1600 pixels.
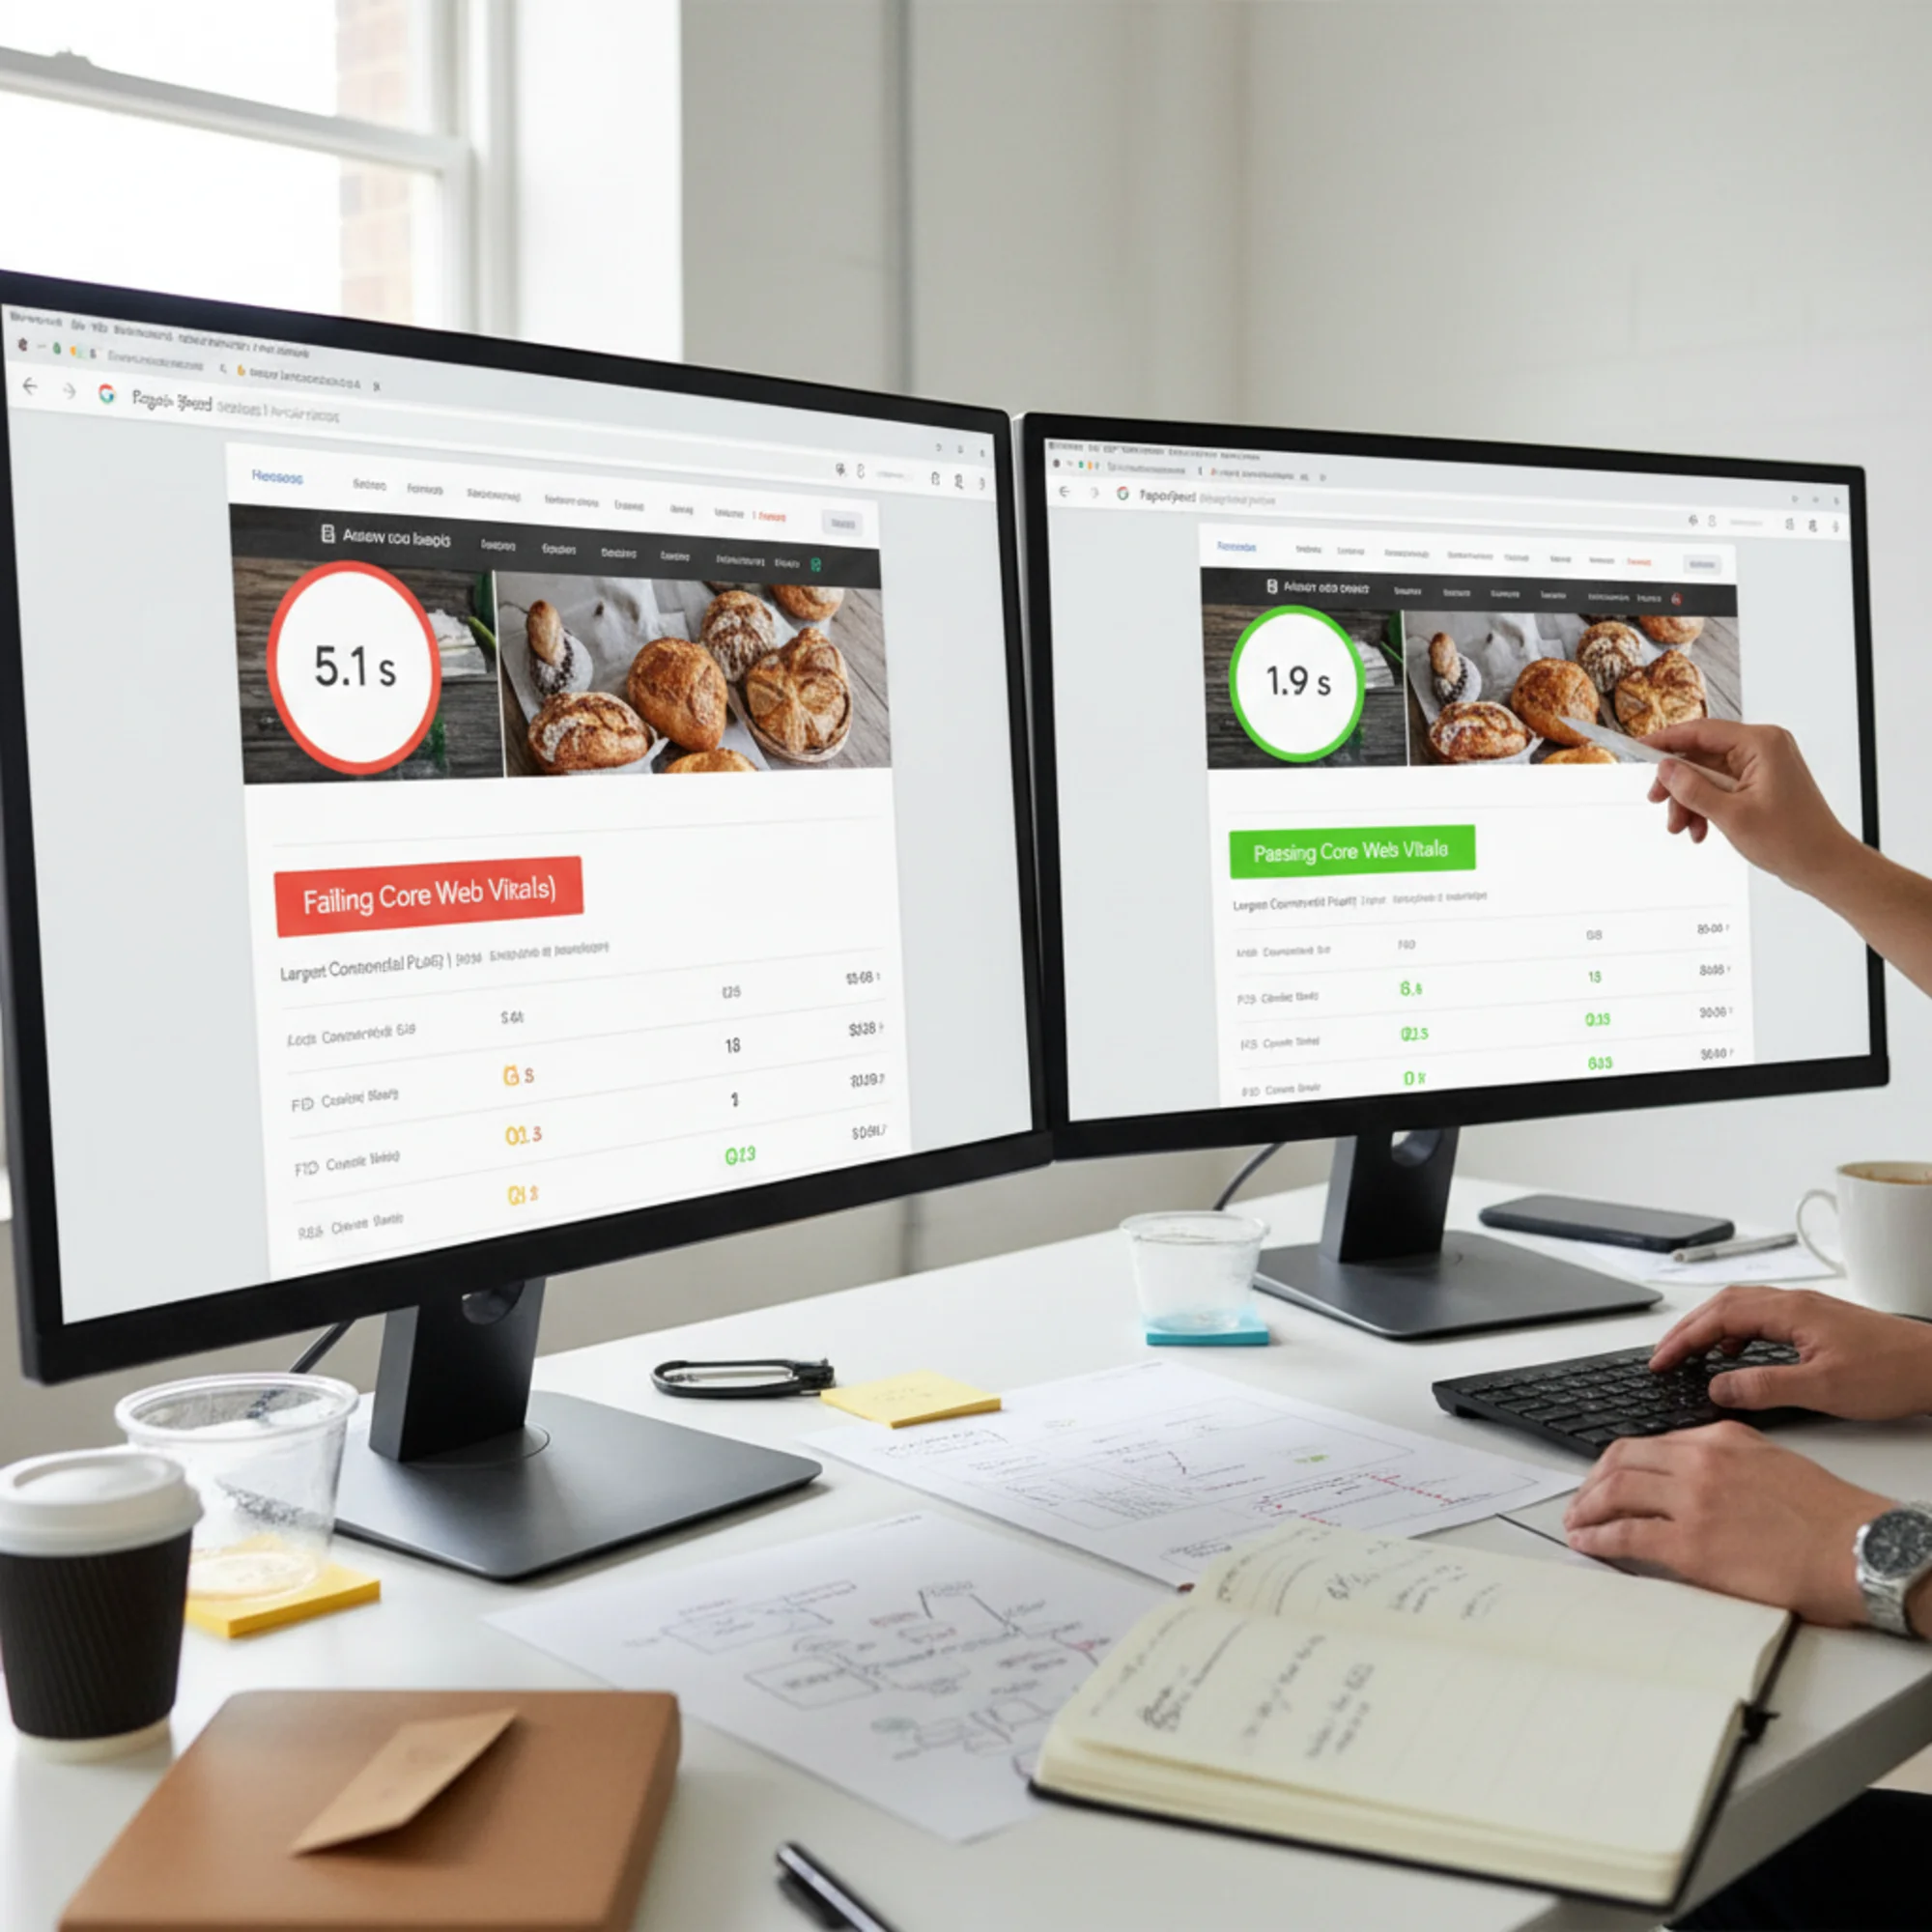
Real-world result: A local bakery's site had a 3.8 MB hero image. The displayed width was 1100 pixels. After resizing to 1320px and converting to WebP at 80% quality, the file dropped to 89 KB. LCP went from 4.7 seconds to 1.9 seconds. One image, one change.

Fix 2: Preload Your LCP Image
Even after compression, the browser may not start downloading your hero image right away. By default, it discovers images only after parsing HTML, loading CSS, and building the layout. This means the browser goes through a multi-step sequence — download HTML, download CSS, parse CSS, discover the image reference, then start downloading the image — before your LCP element even begins loading. A preload hint tells the browser to start the download immediately, in parallel with everything else.
The fix: Add this line to the section of your page:
html
If you use responsive images with srcset, you can preload the appropriate size:
html
On WordPress: Caching plugins like WP Rocket, Perfmatters, or LiteSpeed Cache include a "preload critical images" or "preload LCP image" setting. In WP Rocket, go to Media → Preload Critical Images and set the number to 1 (or more if you have multiple above-the-fold images). In LiteSpeed Cache, look for Page Optimization → Media → Preload Featured Image.
On Shopify: Add the preload tag in your theme's theme.liquid file inside the tag, referencing your hero image's URL.
After adding it:
- Test with PageSpeed Insights to confirm the "Preload Largest Contentful Paint image" warning disappears
- Check the Network tab in Chrome DevTools — the hero image should now appear near the top of the waterfall, not buried beneath CSS and JS files
This typically saves 200 to 800 milliseconds. It costs nothing and takes five minutes.
Fix 3: Remove Render-Blocking Resources
Your page cannot display anything until it finishes loading certain CSS and JavaScript files. If a dozen stylesheets and scripts load in the , nothing appears on screen until they are all processed. Every file in the chain adds delay — often 100 to 400 milliseconds each on mobile connections.
How to check: In PageSpeed Insights, look for "Eliminate render-blocking resources." It lists every file delaying your page render, along with the estimated time savings from addressing each one.
WordPress users:
- Install a caching plugin (WP Rocket, LiteSpeed Cache, or W3 Total Cache)
- Enable "Optimize CSS Delivery" or "Load CSS Asynchronously" — this extracts the CSS needed for the visible portion of the page and loads the rest after the page is visible
- Enable "Defer JavaScript" so scripts load after the page is visible
- Test after each change — some scripts break when deferred. If something breaks, use the plugin's exclusion list to keep that specific script loading normally
- Audit your active plugins: deactivate any you are not using, and check whether multiple plugins serve the same purpose (for example, two SEO plugins or two analytics plugins running simultaneously)
Squarespace, Wix, and Shopify users:
- Remove third-party scripts you are not actively using: old chat widgets, abandoned analytics tools, social media widgets nobody clicks, popup plugins from campaigns that ended months ago
- Each removed script is one less file blocking your render
- On Shopify, review your installed apps — each app often injects its own JavaScript, even if you disabled the app's visible features
- Check for duplicate tracking codes (a common issue is having Google Analytics added both through an integration and as a manual script)
Common culprits to check for:
- Facebook Pixel loaded in the head instead of deferred
- Google Fonts loading multiple weights you do not use (loading Regular and Bold when you also load Light, SemiBold, and ExtraBold)
- jQuery loaded twice (once by your theme, once by a plugin)
- Chat widgets that load 300+ KB of JavaScript for a feature 2% of visitors use
Fix 4: Fix Your Server Response Time
Image compression and preloading cannot help if your server takes 3 seconds to respond. Server response time (Time to First Byte, or TTFB) is the foundation your LCP sits on. Think of it this way: if your server takes 2 seconds to respond, your LCP cannot possibly be faster than 2 seconds plus whatever time it takes to download and render the content.
How to check: In PageSpeed Insights, look for "Reduce initial server response time." A good TTFB is under 200 milliseconds. Anything over 600 milliseconds is a problem worth fixing.
Common causes and fixes:
Cheap shared hosting: If you pay under $10/month and share a server with hundreds of sites, response times will be inconsistent. During peak hours, your TTFB might spike to 2 or 3 seconds because another site on your server is consuming resources. Upgrading to managed hosting (Cloudways, SiteGround's higher tiers, or Kinsta) often cuts TTFB in half. For WordPress, managed WordPress hosts like Flywheel, WP Engine, or Cloudways optimize the server specifically for WordPress workloads.
No page caching: Without caching, your server rebuilds every page from scratch for every visitor. That means running database queries, executing PHP code, and assembling the HTML every single time. Enable full-page caching in WP Rocket, LiteSpeed Cache, or your host's built-in cache. Verify it works by loading your page twice — check the response headers in DevTools (Network tab → click the HTML document → Headers) for a cache hit indicator like x-cache: HIT or cf-cache-status: HIT.
No CDN: A Content Delivery Network stores copies of your site on servers around the world. If your server is in New York and your visitor is in London, a CDN serves from a closer location, cutting hundreds of milliseconds off the response time. Cloudflare offers a free tier that works well for most small business sites — sign up, point your nameservers to Cloudflare, and enable caching with the default settings. The setup takes about 15 minutes and the DNS change propagates within a few hours.
Too many database queries: On WordPress, poorly coded plugins and themes can run 200+ database queries per page load. Install the Query Monitor plugin to see how many queries each page runs and which plugins are responsible. If a single plugin adds 50+ queries, consider replacing it with a lighter alternative.
Fix 5: Stop Lazy-Loading Your LCP Element
Lazy loading tells the browser to skip loading images until a visitor scrolls near them. It is great for images further down the page — a gallery of 20 product photos should absolutely be lazy-loaded. It is terrible for your hero image.
If your LCP element has loading="lazy", you are telling the browser to deliberately delay loading the most important image on your page. The browser waits until the layout is calculated, determines the image is in the viewport, and only then starts the download. This can add 500 milliseconds to 2 seconds of unnecessary delay. Many WordPress themes and page builders apply lazy loading to every image by default, including the first one.
The fix:
- Inspect your hero image's HTML (right-click → View Page Source, search for your image filename)
- If you see
loading="lazy", remove it or change it toloading="eager" - Add
fetchpriority="high"to signal that this image matters most — this tells the browser to prioritize this download over other images and lower-priority resources - The final tag should look something like:

- In WordPress, check your lazy loading plugin or theme settings for an option to exclude above-the-fold images. WP Rocket has "Exclude Above the Fold Images" — set it to at least 1. Some themes have this in Appearance → Customize → Performance
Important note about width and height attributes: Always include explicit width and height attributes on your LCP image. Without them, the browser cannot allocate space for the image before it loads, which delays layout calculations and can add to your LCP time. These attributes also prevent layout shift (improving your CLS score).
This fix alone can save 500 milliseconds to 2 seconds on mobile.
Putting It All Together: A Real Example
The site: A local plumber's one-page WordPress site on shared hosting. PageSpeed Insights shows LCP of 5.8 seconds on mobile. The LCP element is a hero image.
Diagnosis:
- Hero image: 2.4 MB, 4032×3024 pixels, JPEG format (straight from a phone camera)
- No caching plugin installed
- 6 render-blocking scripts, including an unused chat widget and duplicate Google Analytics snippets
- Lazy loading applied to all images, including the hero
- TTFB: 1.8 seconds
- No CDN configured
Fixes applied in order:
- Image (Fix 1): Resized to 1440×810, converted to WebP at 80% quality → 112 KB (down from 2.4 MB). A 95% reduction in file size with no visible quality difference
- Lazy loading (Fix 5): Removed
loading="lazy"from hero, addedloading="eager"andfetchpriority="high" - Preload (Fix 2): Added
to thesection - Render-blocking resources (Fix 3): Removed the unused chat widget (saving 340 KB of JavaScript) and the duplicate analytics script
- Server and caching (Fix 4): Installed LiteSpeed Cache, enabled full-page caching, enabled CSS and JS optimization, and signed up for Cloudflare's free CDN
Result: LCP dropped from 5.8 seconds to 2.1 seconds. TTFB went from 1.8 to 0.4 seconds. All three Core Web Vitals now passing. Total time: about 45 minutes, no developer needed.
The biggest single improvement came from the image optimization (Fix 1), which accounted for roughly 2 seconds of the total 3.7-second improvement. The caching and CDN changes (Fix 4) contributed another 1.4 seconds. The remaining fixes each shaved off a few hundred milliseconds.
Quick-Reference Checklist
Use this checklist after identifying your LCP element. Work through each item in order — the fixes are listed from highest impact to lowest:
- [ ] Identified my LCP element using PageSpeed Insights
- [ ] Resized the LCP image to match display size (plus 20% for Retina)
- [ ] Converted to WebP format
- [ ] Compressed to 80% quality, targeting under 200 KB
- [ ] Added a preload hint for the LCP image in the
section - [ ] Removed
loading="lazy"from above-the-fold images - [ ] Added
fetchpriority="high"to the LCP image - [ ] Added explicit
widthandheightattributes to the LCP image - [ ] Removed unused scripts, plugins, and widgets
- [ ] Enabled CSS optimization and JavaScript deferral
- [ ] Enabled full-page caching
- [ ] Set up a CDN (Cloudflare free tier)
- [ ] Verified TTFB is under 600 milliseconds
- [ ] Retested with PageSpeed Insights to confirm improvement
- [ ] Checked both mobile and desktop scores (mobile is usually the bottleneck)
What Not to Bother With (Yet)
Some commonly recommended optimizations barely move the LCP needle for typical small business sites. Save these for after you have completed the five core fixes:
Font optimization: Unless you load five or more custom fonts or use very large font files, font loading is rarely your LCP bottleneck. If your LCP element is an image, font tweaks will not help that metric. Worth revisiting if your LCP element is a text block.
Inline critical CSS: An advanced technique that extracts the CSS needed for above-the-fold content and embeds it directly in the HTML. It shaves 100 to 200 milliseconds on most sites. Worth doing after the big wins, not before. Most caching plugins handle this automatically if you enable the "Generate Critical CSS" option.
Image CDN services (Cloudinary, Imgix): Good products for sites with thousands of images, but for a single hero image on a small business site, Squoosh does the same job for free in 30 seconds. Consider these services if you have a large product catalog or frequently changing images.
HTTP/3 and QUIC: Newer protocols that slightly improve connection times. Your hosting provider or CDN handles this — you cannot toggle it manually on most platforms, and the improvement over HTTP/2 is marginal for simple websites.
Complete the five fixes above first. They account for 80% or more of the LCP improvement on most small business sites.
Common Mistakes That Undo Your Progress
After fixing your LCP, it is easy to accidentally undo the work. Watch out for these common pitfalls:
Uploading unoptimized images later: You fix the hero image, but a month later someone uploads a 4 MB photo for a blog post that appears above the fold. Set up automatic image optimization (ShortPixel, Imagify, or your CDN's image optimization) so every future upload is handled.
Adding new third-party scripts: A marketing team member installs a heatmap tool, a new chat widget, and a popup builder. Each one adds render-blocking JavaScript. Require a quick PageSpeed check before and after installing any new tool.
Theme or plugin updates resetting settings: Some WordPress updates reset lazy loading behavior or caching settings. After major updates, re-run PageSpeed Insights to verify nothing regressed.
Switching themes: A new theme may load different CSS and JavaScript, re-apply lazy loading to all images, and change the hero image dimensions. Treat a theme change as a reason to re-audit everything.
Monitor Your LCP Over Time
Fixing LCP once is not enough. New images, plugin updates, and content changes can push it back into the red.
Google Search Console: Go to Core Web Vitals in the left sidebar. Google tracks real-world LCP data from Chrome users visiting your site and flags pages that fall below the threshold. This data is based on actual visitors, making it the most reliable measure of your real-world performance. Check it monthly — it takes 28 days for changes to fully reflect in the data.
PageSpeed Insights: Use this for immediate feedback after making changes. Lab data (the simulated test) gives you instant results, while field data (real users) takes weeks to update. Use lab data to verify your fixes worked, and field data to confirm the improvement holds in the real world.
Regular audits: Tools like FreeSiteAudit check your Core Web Vitals alongside dozens of other ranking factors. Running a free audit monthly or after major site changes catches problems before they affect your rankings. It also helps you track improvements over time so you can see the impact of each change you make.
Take Action Today
Start with Fix 1 — resize and compress your hero image. It takes five minutes and usually delivers the single biggest improvement. If you only do one thing from this entire guide, make it that.
To see exactly where your site stands right now, run a free audit with FreeSiteAudit. You will get a clear breakdown of your LCP score, other Core Web Vitals, and specific recommendations you can act on today. No credit card required — just a straightforward report on what is slowing your site down and how to fix it.
Sources
Check your website for free
Get an instant score and your top 3 critical issues in under 60 seconds.
Get Your Free Audit →