Render-Blocking CSS: How to Speed Up Above-the-Fold Content
Learn how render-blocking CSS slows your site. Get a step-by-step guide to inlining critical styles, deferring the rest, and faster above-the-fold loads.
# Render-Blocking CSS: How to Speed Up Above-the-Fold Content
Your website might load in three seconds. But if visitors stare at a blank white screen for the first 1.5 seconds, most of them are already gone. The culprit is often render-blocking CSS — stylesheets that force the browser to halt all rendering until they finish downloading and parsing.
This is not a niche developer concern. Render-blocking CSS is one of the most common performance problems on small business websites, and it is one of the most fixable. If your PageSpeed Insights score is stuck in the red or orange zone, there is a strong chance render-blocking stylesheets are the reason.
This guide explains what render-blocking CSS is, why it directly hurts your traffic and revenue, and how to fix it step by step — whether you run WordPress, Shopify, or a custom-coded site.
What "Render-Blocking" Actually Means
When someone visits your site, the browser reads your HTML top to bottom. Every time it encounters a tag pointing to a CSS file, it stops rendering completely. It downloads the entire stylesheet, parses every rule inside it, and only then continues building the visible page.
This is intentional behavior. The browser avoids showing unstyled content that would jump around once styles arrive. Without this safeguard, visitors would see raw text, improperly sized images, and elements shifting into position — a jarring experience known as a Flash of Unstyled Content (FOUC).
But the cost of this safety mechanism adds up fast. If your page header references four CSS files — theme styles, Google Fonts, a slider plugin, and a page builder stylesheet — the browser must download and process all four before painting a single pixel on screen.
Here is a simplified timeline of what happens:
- Browser requests your HTML — takes 200–400 ms on average
- Browser parses the
and finds fourtags - Browser sends four separate HTTP requests for CSS files
- Each file takes 100–300 ms to download (depending on file size and connection speed)
- Browser parses all four stylesheets and builds the CSS Object Model (CSSOM)
- Only now does the browser begin painting pixels to the screen
Your HTML is ready. Your content is there. But the visitor sees nothing because the browser is still waiting on stylesheets. On a mobile phone with a typical 4G connection, steps 3 through 5 alone can take 800 milliseconds to over two seconds.

Why This Matters for Your Business
Render-blocking CSS affects two things directly: the experience visitors have on your site and where Google ranks your pages in search results.
Visitor Experience and Bounce Rates
Google research shows that as page load time increases from one to three seconds, bounce probability rises by 32%. When load time hits five seconds, that probability jumps to 90%. Render-blocking CSS is one of the most common causes of that initial blank-screen delay — the period where a visitor sees nothing at all and decides whether to wait or hit the back button.
This blank-screen time is psychologically different from a slow-loading page where content appears progressively. A visitor who sees a headline and a partially loaded image knows the page is working. A visitor who sees a white screen for 1.5 seconds assumes the site is broken.
For an e-commerce site, even a 100-millisecond delay in load time can reduce conversion rates by 7%, according to Akamai research. For a local service business, that blank-screen delay means potential customers bounce back to Google and click on a competitor.
Search Rankings and Core Web Vitals
Google uses Core Web Vitals as a ranking signal. The metric most affected by render-blocking CSS is Largest Contentful Paint (LCP) — the time it takes for the largest visible content element (usually a hero image or headline) to appear on screen. Google considers LCP over 2.5 seconds poor, and render-blocking CSS is a top reason sites fail this threshold.
When your LCP is in the red zone, Google may rank competitors with better performance above you — even if your content is stronger. This is especially impactful in local search, where a handful of positions can mean the difference between getting calls and being invisible.
A Real Cost Example
Consider a local bakery with a WordPress site running WooCommerce, a contact form plugin, and Google Fonts. Each adds its own CSS file. The theme itself loads two stylesheets. That is five render-blocking CSS files before the browser can show anything.
On a mobile phone with average 4G speeds, those extra downloads can add 800 milliseconds to a full second of blank-screen time before a visitor sees a single product photo. If the bakery gets 500 mobile visitors per month and 15% bounce because of that delay, that is 75 lost potential customers — many of whom were ready to place an order.

How to Check If You Have Render-Blocking CSS
Before fixing anything, confirm the problem and measure its severity. You need a baseline to know whether your changes actually helped.
Quick Check with PageSpeed Insights
- Go to PageSpeed Insights and enter your URL
- Run the test on Mobile (this is what Google uses for rankings)
- Scroll to the Diagnostics section
- Look for "Eliminate render-blocking resources" in the list
- Expand it to see every blocking CSS and JavaScript file with estimated time savings
The render-blocking section typically shows entries like:
style.css— your theme's main stylesheet (often 80–200 KB)fonts.googleapis.com— Google Fonts stylesheet (usually 1–5 KB, but triggers additional font file downloads)plugin-name/css/frontend.css— plugin stylesheets (10–80 KB each)elementor/css/frontend-lite.min.css— page builder styles (50–150 KB)
Each file forces the browser to stop and wait. The more files and the larger they are, the longer the delay.
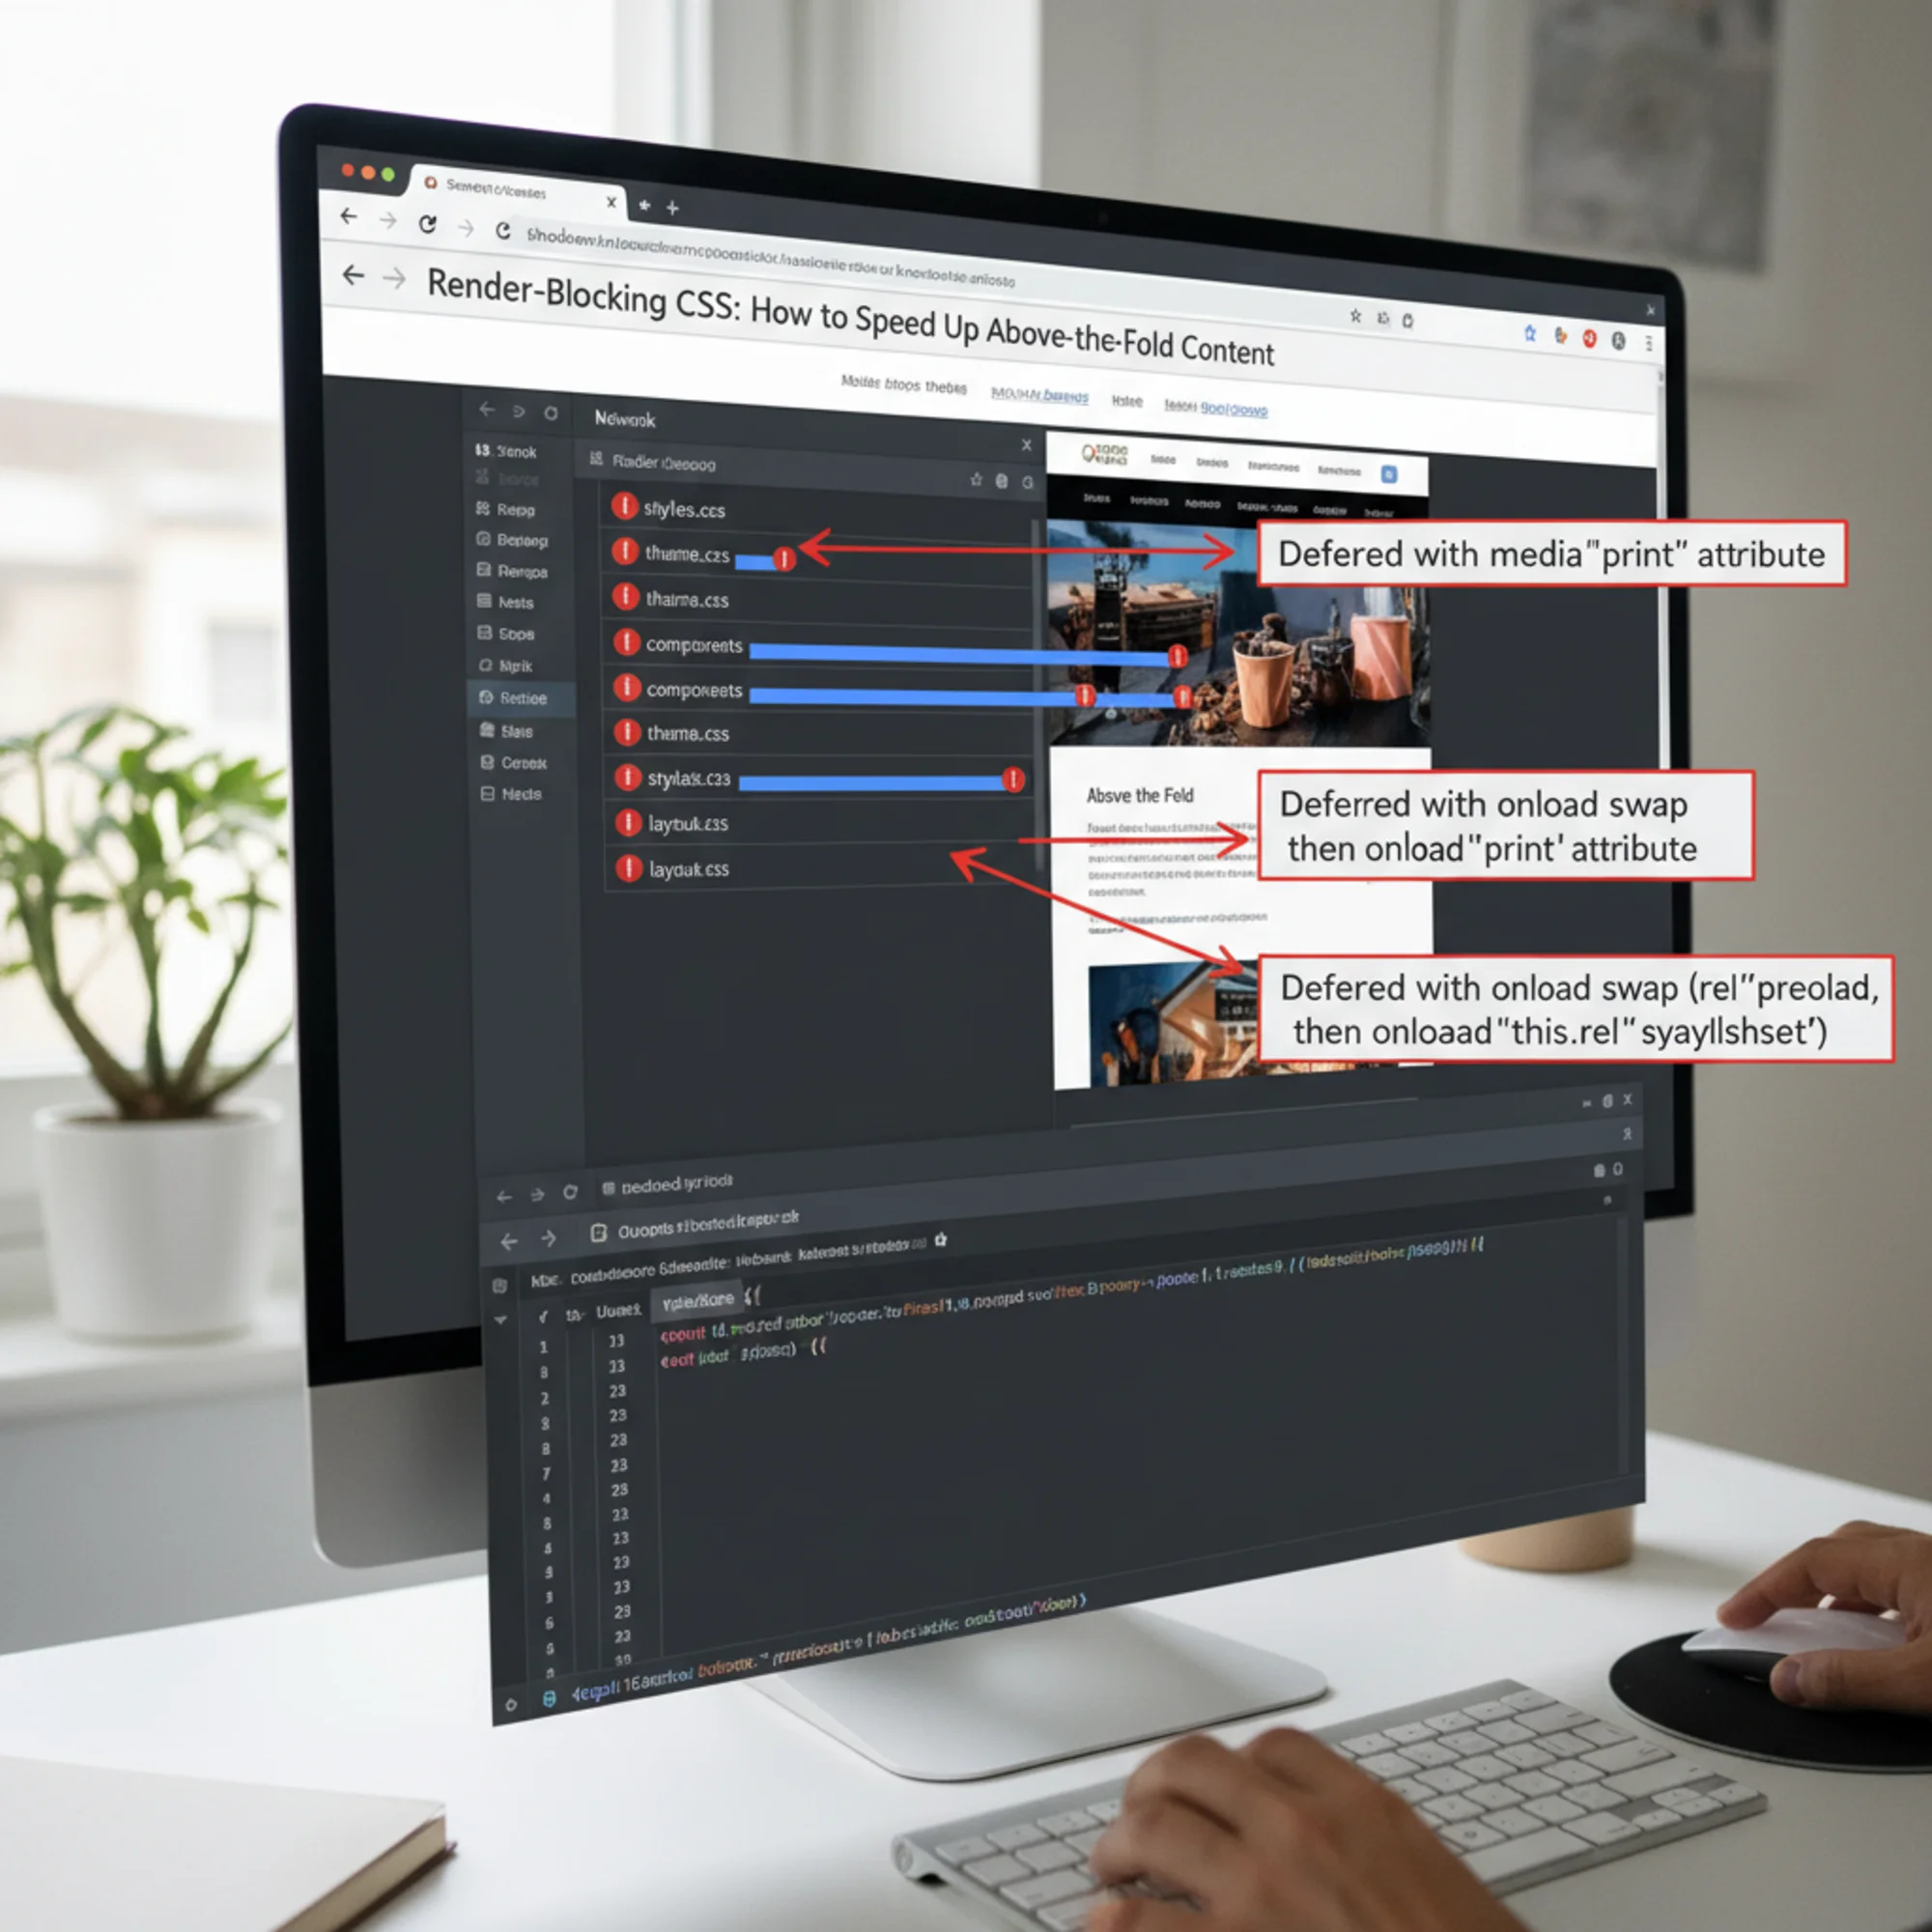
Deeper Analysis with Chrome DevTools
For a more detailed view:
- Open Chrome DevTools (F12 or right-click → Inspect)
- Go to the Performance tab
- Click the record button, then reload the page
- Look at the Network row in the timeline — CSS files appear as blue bars
- The gap between the first HTML response and the first paint is largely caused by render-blocking CSS
You can also use the Coverage tab (Ctrl+Shift+P → "Show Coverage") to see how much of each CSS file is actually used on the current page. It is common to find that 70–90% of a large stylesheet is unused on any given page.
Using FreeSiteAudit
For a comprehensive view that includes render-blocking resources alongside all other performance issues, run a free audit with FreeSiteAudit. It flags render-blocking CSS specifically and shows how it affects your overall performance score.
The Fix: Critical CSS and Deferred Loading
The solution has two parts that work together:
- Inline the critical CSS — extract and embed only the styles needed for content visible without scrolling (above the fold)
- Defer everything else — load the remaining styles in the background without blocking rendering
The browser gets just enough CSS to render what the visitor sees first, then loads the complete stylesheet after the page is already visible. The visitor perceives an instant load even though the full CSS still takes the same time to download.
What Counts as "Above the Fold"
Above the fold is the content visible on screen before the visitor scrolls. The exact pixels depend on the device — a desktop monitor shows more than a phone screen — but for most small business sites, the above-the-fold area includes:
- Navigation bar — logo, menu links, phone number
- Hero section — main headline, subheadline, background image or color
- Primary call-to-action button — "Get a Quote," "Order Now," "Book Appointment"
- Basic layout styles — body font, text colors, page width, spacing, grid or flexbox layout
Everything below — testimonials, service descriptions, team photos, FAQ sections, footer — can wait a fraction of a second longer to be styled. The visitor will never notice the delay because they are still reading the above-the-fold content.
The critical CSS for most small business homepages is 15–30 KB of CSS. Compare that to the full stylesheet, which is often 100–300 KB. You are giving the browser 80–90% less work to do before it can start painting.
Step-by-Step: Fixing Render-Blocking CSS
Option 1: WordPress Plugins (Easiest)
If you are on WordPress, an optimization plugin can handle critical CSS extraction and stylesheet deferral automatically. This is the recommended approach for non-developers.
WP Rocket (paid, approximately $59/year) or LiteSpeed Cache (free with LiteSpeed hosting):
- Install and activate the plugin
- Navigate to CSS optimization settings
- Enable "Remove Unused CSS" or "Load CSS Asynchronously"
- Enable "Generate Critical CSS" (WP Rocket calls this "Optimize CSS Delivery")
- Save and clear all caches
- Wait 2–5 minutes for critical CSS generation to complete (it processes each page template)
Autoptimize (free, works with any host):
- Install and activate Autoptimize
- Go to Settings → Autoptimize
- Check "Optimize CSS Code"
- Check "Aggregate CSS files" to combine multiple files into one
- Check "Inline and Defer CSS"
- Save changes and clear cache
After any plugin change, run through this verification checklist:
- [ ] Homepage looks correct on first load in an incognito window (no flash of unstyled content)
- [ ] Mobile layout renders properly — check navigation, hero section, and buttons
- [ ] Re-run PageSpeed Insights — is the "Eliminate render-blocking resources" warning resolved or reduced?
- [ ] Check that fonts load correctly (text should not permanently display in a fallback font)
- [ ] Spot-check two or three inner pages (a service page, a blog post, the contact page)
- [ ] Test any interactive elements — dropdown menus, sliders, accordions, forms
If you see a brief flash of unstyled content (wrong fonts or colors for a split second), the critical CSS generation missed some styles. Most plugins let you add custom critical CSS to fix these edge cases.
Option 2: Shopify Stores
Shopify handles some optimization automatically, but theme CSS can still be render-blocking.
- Minimize apps. Each Shopify app can inject its own CSS file. Audit your installed apps and remove any you are not actively using.
- Use a performance-focused theme. Themes like Dawn (Shopify's default) are optimized for performance. Older or heavily customized themes often load excessive CSS.
- Defer non-critical CSS with theme code edits. In your theme's
theme.liquidfile, apply themedia="print" onload="this.media='all'"technique (detailed below) to non-essential stylesheets. - Use Shopify's built-in performance report under Online Store → Themes → your theme → "..." → Speed report.
Option 3: Manual Implementation (Custom Sites)
For custom-built sites or situations where plugins are not an option, here is the step-by-step process.
Step 1: Extract Critical CSS
Use a critical CSS generator tool. These tools load your page in a headless browser, determine which CSS rules apply to the visible viewport, and output only those rules. The output is typically 10–30 KB instead of your full 100–300 KB stylesheet.
Popular tools for generating critical CSS include the critical npm package (for build pipelines), Penthouse (another npm tool), and various online generators where you paste your URL.
For a build-tool approach with the critical npm package:
bash
npx critical https://yoursite.com --inline --minify > critical-output.html
This generates an HTML file with inline critical CSS already embedded — you can extract the
This loads instantly because it is embedded in the HTML document itself — no extra network request required. The browser can start painting the above-the-fold content immediately after parsing the HTML .
Step 3: Defer the Full Stylesheet
Replace your normal CSS link with a deferred version:
html
onload="this.onload=null;this.rel='stylesheet'">
The rel="preload" attribute tells the browser to download the CSS file at high priority but without blocking rendering. The onload handler switches it to a regular stylesheet once the download completes. The this.onload=null prevents an infinite loop in some browsers. The fallback ensures the stylesheet still loads for visitors with JavaScript disabled.
An alternative approach using the media attribute:
html
onload="this.media='all'">
This works because the browser treats media="print" stylesheets as non-blocking for screen rendering. Once loaded, the onload handler switches the media to all, applying the styles to the screen.
Step 4: Handle Google Fonts
Google Fonts is one of the most common render-blocking resources on small business websites. The browser must connect to fonts.googleapis.com, download a CSS file that lists font URLs, then connect to fonts.gstatic.com and download the actual font files. That chain of requests can add 500 ms or more.
Fix it with preconnect hints and deferred loading:
html
rel="stylesheet" media="print" onload="this.media='all'">
The media="print" trick tells the browser this stylesheet is for printing, so it does not block screen rendering. Once loaded, onload switches it to apply to all media. The display=swap parameter keeps text visible with a system fallback font while the custom font downloads — visitors can read your content immediately instead of seeing invisible text.
Even better: self-host your fonts. Download the font files, place them in your project, and reference them with @font-face in your critical CSS. This eliminates two external connections entirely and gives you full control over caching.
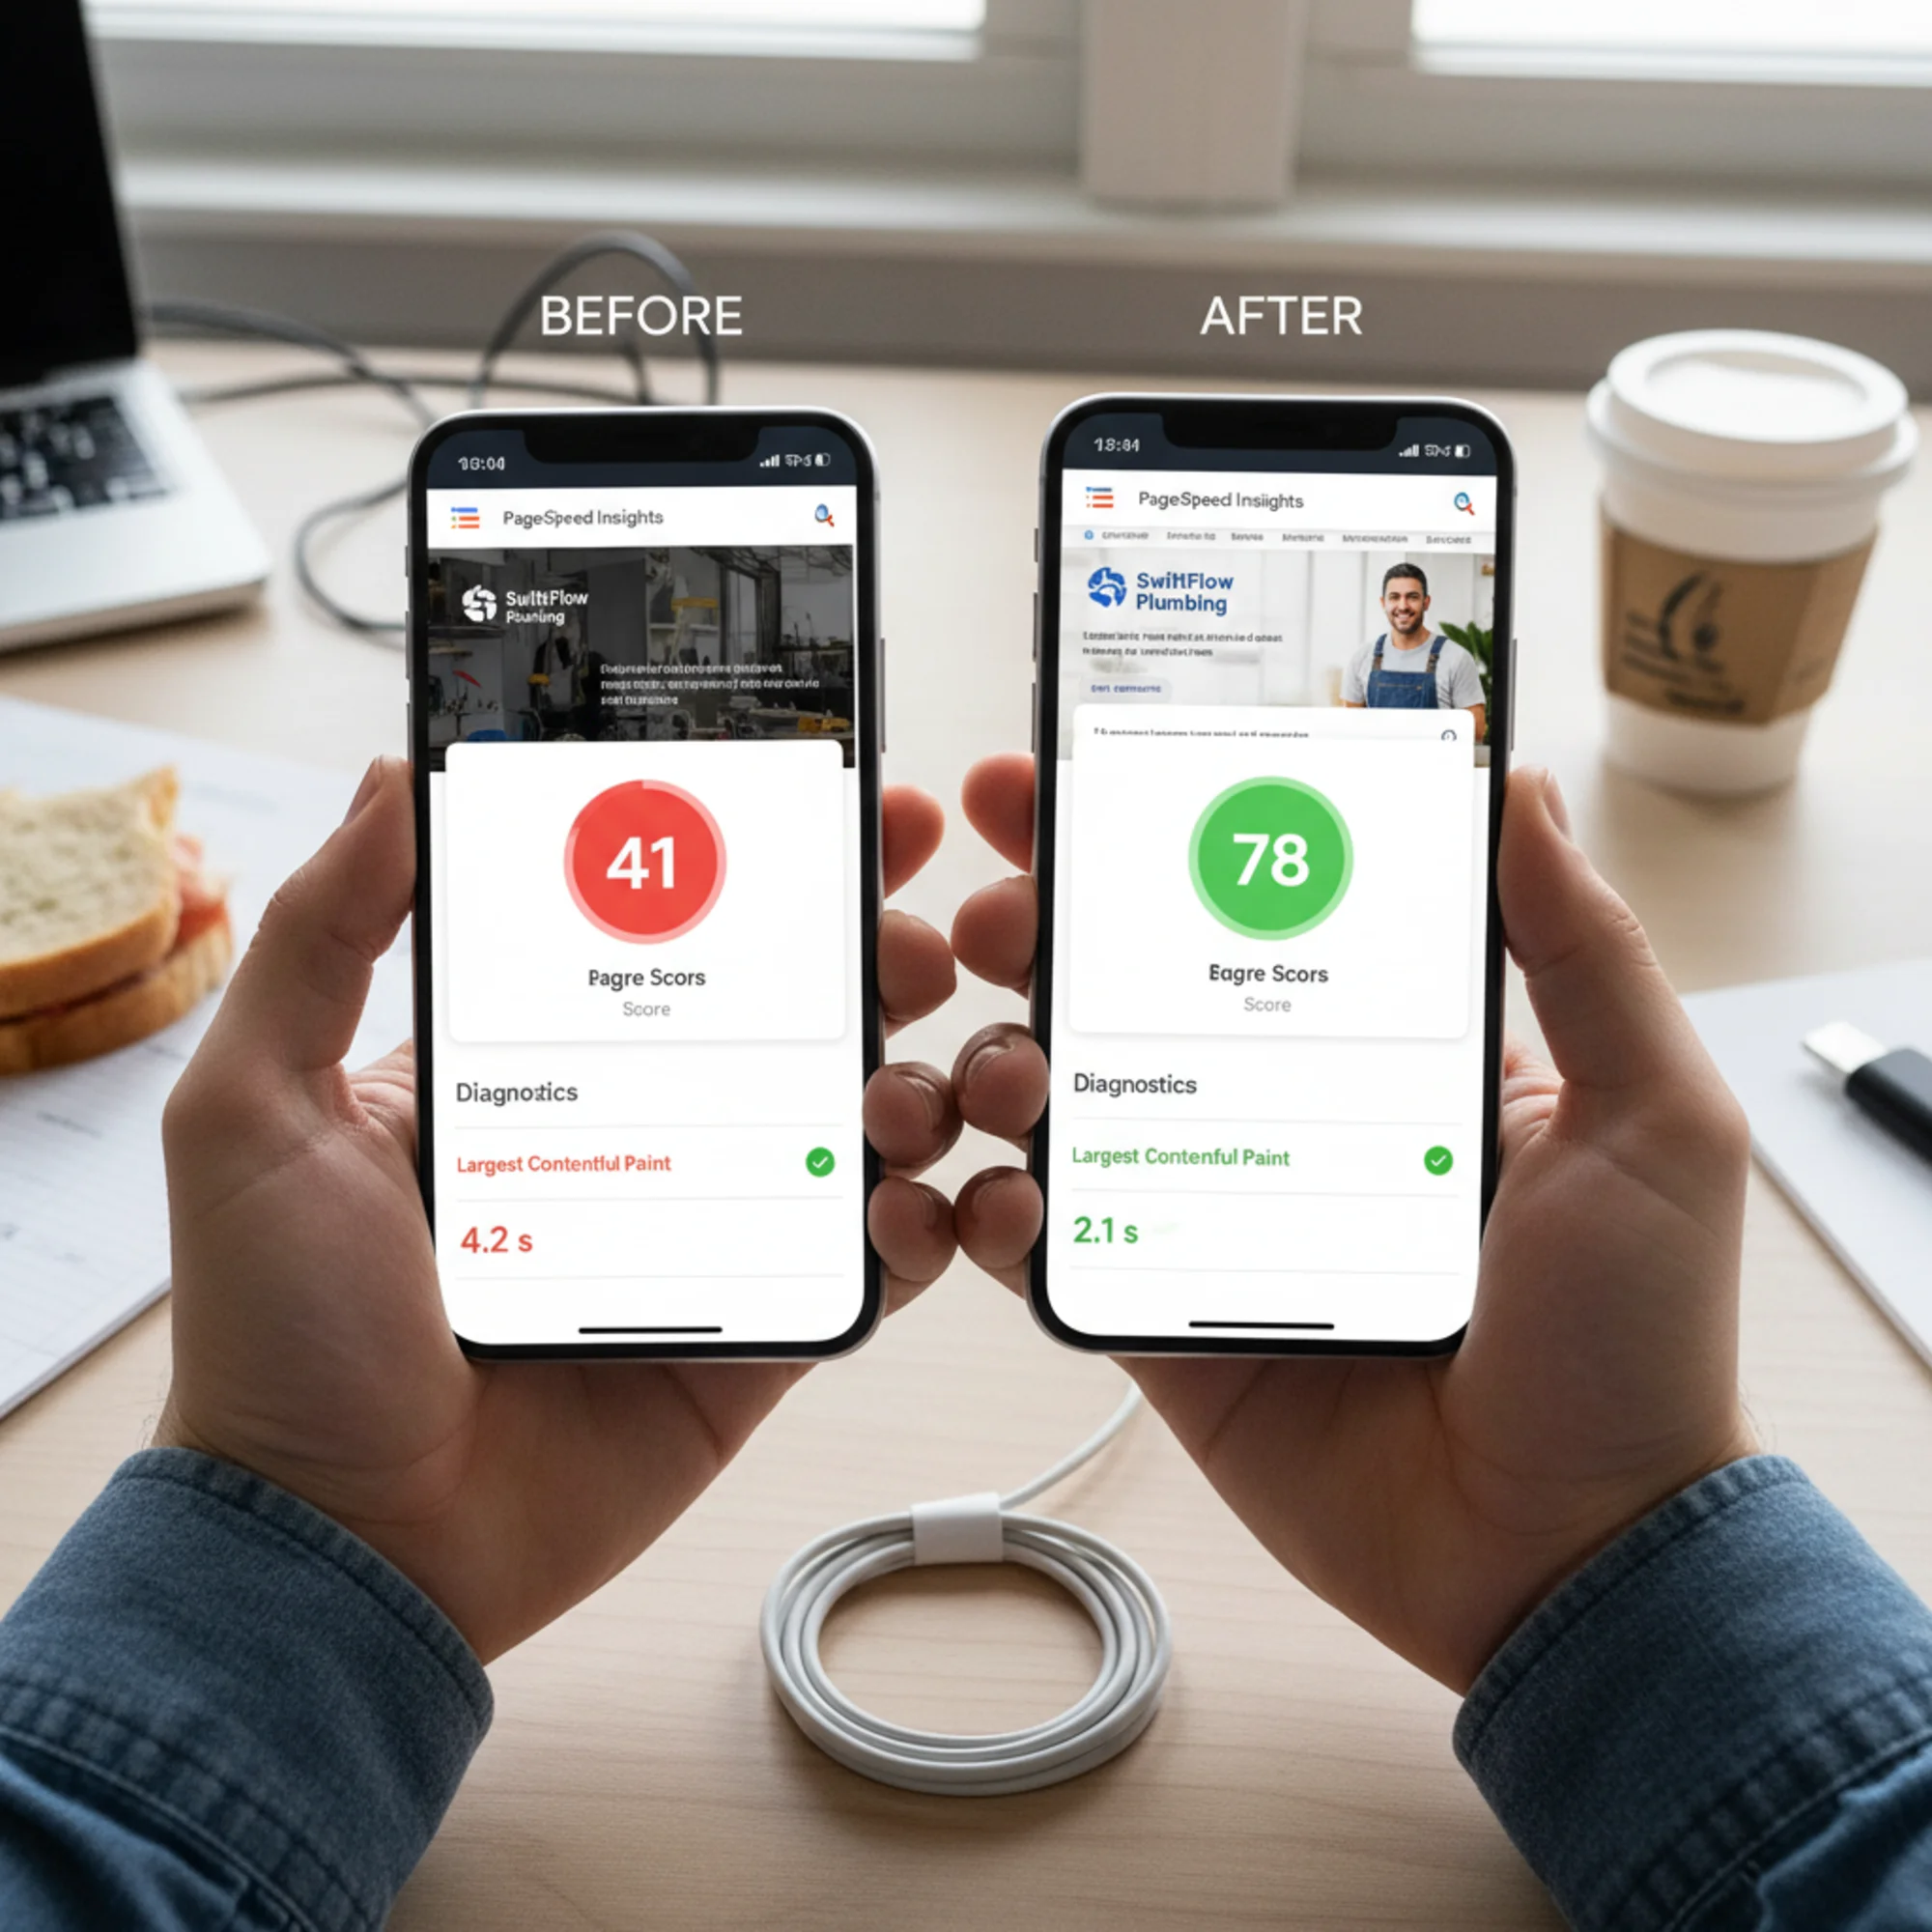
Real-World Example: A Local Plumbing Company
Sarah runs a plumbing company in Austin. Her WordPress site uses the Astra theme, Elementor page builder, a booking plugin, WooCommerce (for selling maintenance plans), and Google Fonts. She ran a PageSpeed Insights test and found:
- Performance score: 41 (mobile) — deep in the red zone
- LCP: 4.2 seconds — nearly double the 2.5-second threshold
- Render-blocking resources: 6 CSS files, estimated savings of 1.8 seconds
- Total CSS loaded: 340 KB across all files
- CSS actually used on homepage: approximately 45 KB
Here is what she fixed, in order:
1. Installed LiteSpeed Cache (her hosting provider, NameHero, supports LiteSpeed natively).
2. Enabled CSS optimization: Page Optimization → CSS Settings → turned on "Load CSS Asynchronously" and "Generate Critical CSS." She waited five minutes for critical CSS generation to process her main page templates.
3. Optimized Google Fonts: Installed the OMGF (Optimize My Google Fonts) plugin, which downloads font files to her server and rewrites the CSS to reference local copies. This eliminated two external DNS lookups and two external connection handshakes.
4. Removed unused plugin CSS from non-relevant pages: The booking plugin loaded its 65 KB stylesheet on every page, but the booking form only appeared on the contact page. She installed Asset CleanUp (free) and disabled the booking plugin's CSS on all pages except the contact page. She also disabled WooCommerce CSS on pages that had no shop content.
5. Verified everything worked:
- Checked the homepage, three service pages, and the blog in incognito mode on her phone
- Confirmed the booking form still looked correct on the contact page
- Checked that the navigation dropdown worked properly
- Verified Google Fonts loaded correctly (no permanent fallback fonts)
Results after clearing cache and retesting:
- Performance score: 78 (mobile) — up 37 points, from red to orange/green
- LCP: 2.1 seconds — under the 2.5-second Good threshold
- Render-blocking resources: 1 file remaining (down from 6)
- Total CSS on initial load: 22 KB inline critical + rest deferred
Total time: about 30 minutes. No custom code. No developer needed.
Common Mistakes to Avoid
Inlining too much CSS. Critical CSS should be 15–30 KB. Inlining your entire 200 KB stylesheet defeats the purpose — it makes the HTML document itself too large, which slows the initial server response. The goal is the minimum CSS needed to render the above-the-fold area correctly.
Incomplete critical CSS. If you see a flash of unstyled content after deferring — text appearing in the wrong font, background colors flickering, or elements jumping into position — your critical CSS is missing styles for visible elements. Test in an incognito window with cache disabled. Add any missing rules to the inline