Why Your Core Web Vitals Score Differs in Lab vs Field (And Which One Actually Matters)
PageSpeed shows a green 95 but Search Console flags poor URLs? Here's why lab and field Core Web Vitals disagree—and which score Google actually ranks on.
# Why Your Core Web Vitals Score Differs in Lab vs Field (And Which One Actually Matters)
You ran a speed test on your homepage. PageSpeed Insights gave you a green 95. You felt good for about an hour.
Then you opened Google Search Console and saw a red banner: "Poor URLs" on Core Web Vitals. Same site. Same day. Two completely different verdicts.
If this has happened to you, you're not losing your mind. You're seeing the difference between lab data and field data — and most small business owners have no idea these are two separate things. Worse, they often act on the wrong one.
This post walks through what's actually happening, why the numbers disagree, and which score Google uses when it decides how to rank you.
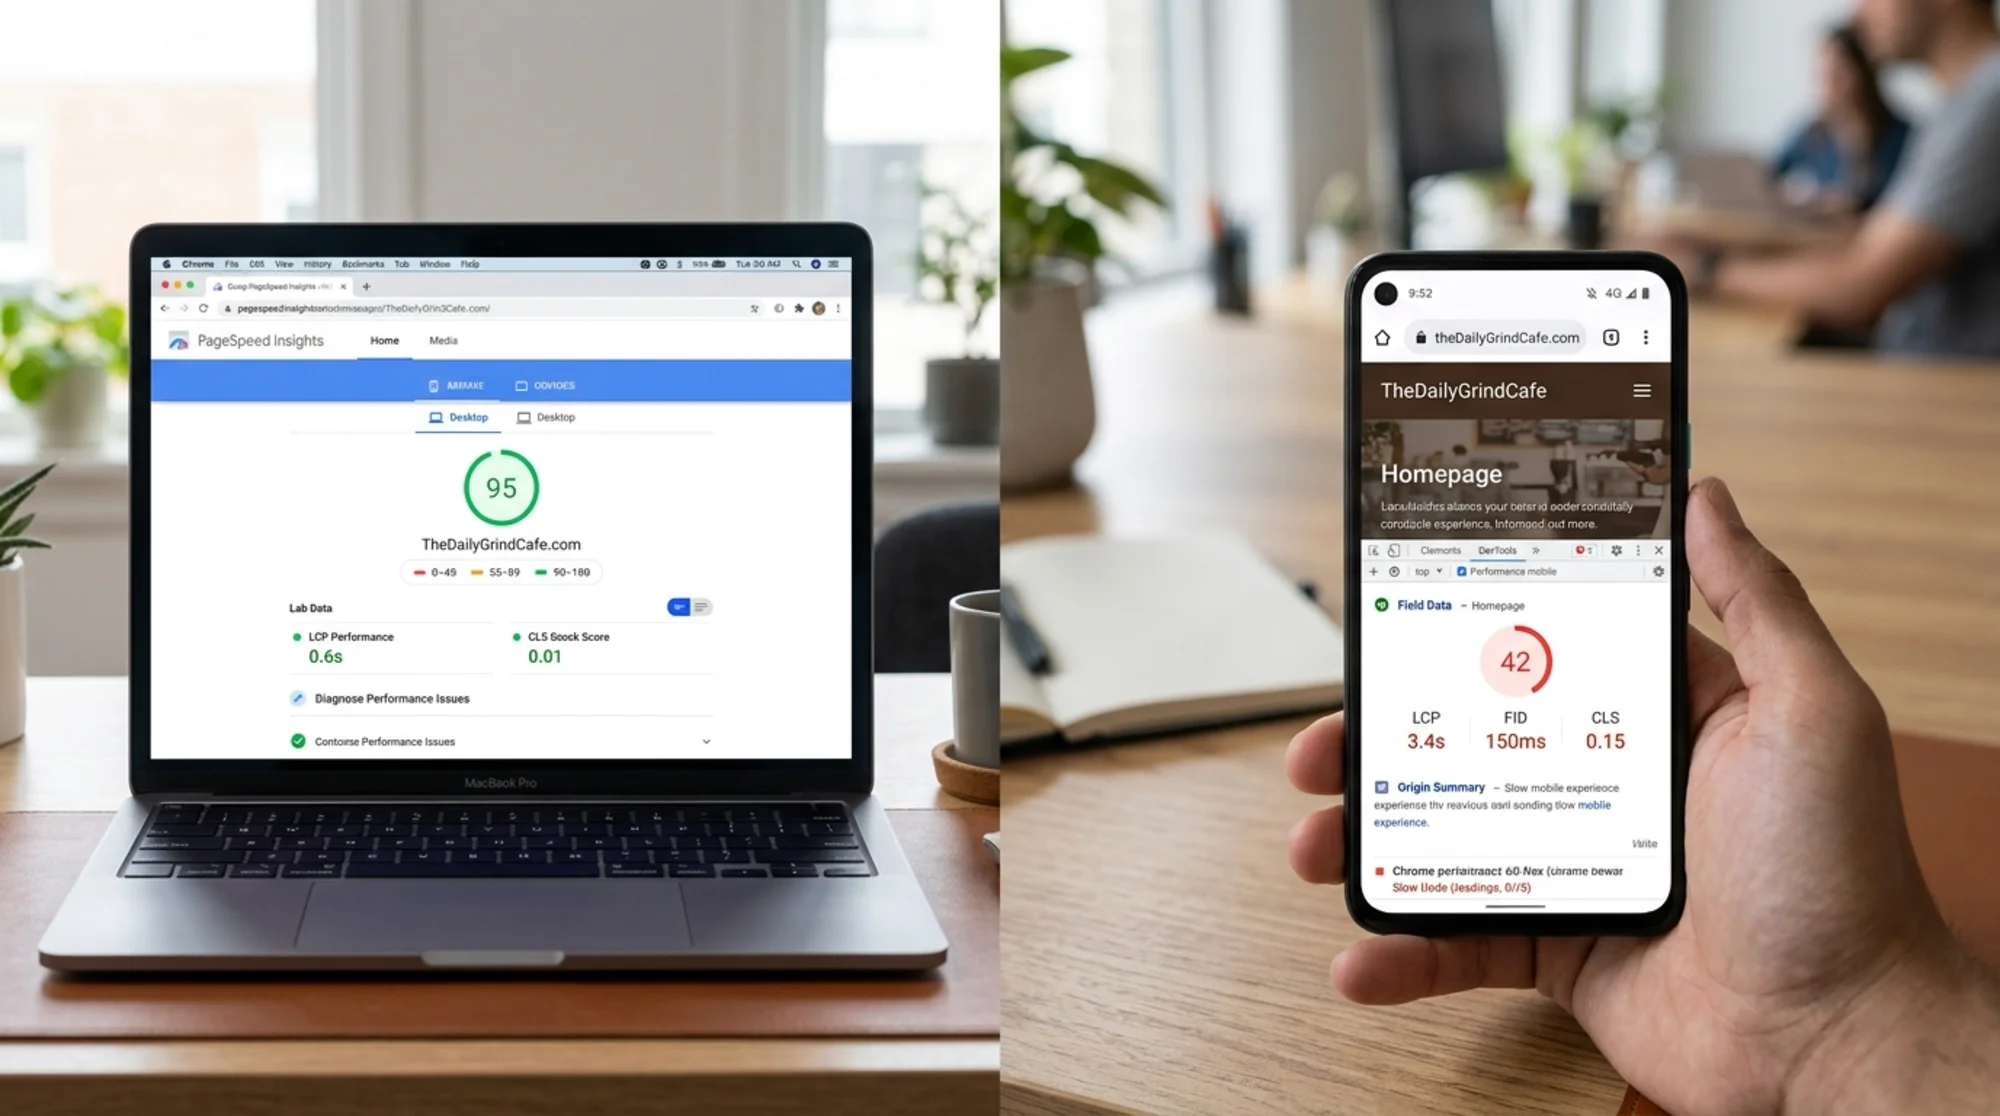
The Two Types of Speed Data, Explained Plainly
Every speed tool you've used is reporting one of two things. Knowing which is which is the entire game.
Lab data is a single test, run from a single machine, on a single network, at a single moment. The tool loads your page in a clean, controlled environment and measures what happened. It's reproducible. It's tidy. It gives you a number in 15 seconds.
Field data is the average experience of your real visitors over the last 28 days. Every time someone in Chrome visits your page, their browser quietly records how long things took and sends that data back to Google. The result is a rolling 28-day window of actual human experience — on their phones, on their wifi, on their cellular signal, with their browser extensions, in their parking lots.
When PageSpeed Insights opens, it shows you both. The top section ("Discover what your real users are experiencing") is field data. The bottom section ("Diagnose performance issues") is lab data. Most people scroll past the top and only look at the bottom number. That's the mistake.
Google uses field data to decide whether your site passes Core Web Vitals. The lab score is a diagnostic tool — useful for fixing problems, but not what shows up in Search Console and not what affects rankings.
Why the Two Disagree
Once you understand that lab is one synthetic test and field is thousands of real visits, the disagreements stop being mysterious. Here are the most common reasons they tell different stories.
1. The Test Device vs. Your Actual Customers
Lab tools simulate a "Moto G Power" or similar mid-tier Android phone. That sounds reasonable. But your actual customer base might skew toward older phones, newer phones, iPhones, or desktops. If half your traffic comes from people on three-year-old Androids with weak processors, your real-world numbers will be slower than the simulated mid-tier device.
A bakery in a small town might have customers searching from older phones with patchy LTE. A B2B consultancy in a major city might have customers on the latest iPhones and fast wifi. The lab test treats both the same. The field data tells the truth.
2. The Network
Lab tests throttle the connection to a fixed "Slow 4G" or "Fast 3G" profile. Field data measures whatever your visitor actually had. A customer on rural cellular gets a different experience than one on office fiber. If your traffic is mostly mobile in areas with mediocre signal, your field LCP (Largest Contentful Paint) will be noticeably worse than your lab test shows.
3. Caching, Cookies, and Returning Visitors
Lab tools always load your page with an empty cache, no cookies, no logged-in state. That's the "first visit" experience. Field data includes everyone — returning visitors, logged-in users, people who have your site cached. Sometimes this makes field data better than lab (returning visitors load faster). Sometimes it makes it worse (logged-in users hit dynamic pages without cached assets).
4. Interactions You Can't Simulate
Lab tests can measure how fast your page loads, but they can't measure what happens when someone taps a button, opens a menu, or fills out a form. That's where INP (Interaction to Next Paint) comes in — and INP only really exists in field data. If your "Order Now" button takes 500ms to respond because of a heavy JavaScript handler, the lab test won't catch it. But every real visitor who taps it contributes that data point.
5. Third-Party Scripts Behaving Differently in the Wild
Your live ad script, your live chat widget, your analytics tag, your A/B testing tool — they all behave differently under real-world conditions. A chat widget might be invisible on a lab test (because the test ran in 15 seconds and the widget loads after 20) but visible to most real visitors. Its weight only shows up in field data.
6. Different Pages Get Different Treatment
Lab tests measure one URL at a time. Field data in Search Console groups URLs together by similarity. If 9 out of 10 product pages are fine but one slow product page is your top-trafficked landing page, your overall field data can look bad even when most pages test green individually.
A Real Scenario: The Bakery That Couldn't Trust Its Own Numbers
A small bakery — call it Maple Lane — runs on Shopify. The owner reads about Core Web Vitals, runs PageSpeed Insights on her homepage, and gets a 92 mobile score. Green. She closes the tab and moves on.
Two weeks later, she gets an email from Search Console: "Core Web Vitals issues detected." LCP in the "Poor" range.
She runs PageSpeed Insights again. Still 92. Still green. She's confused.
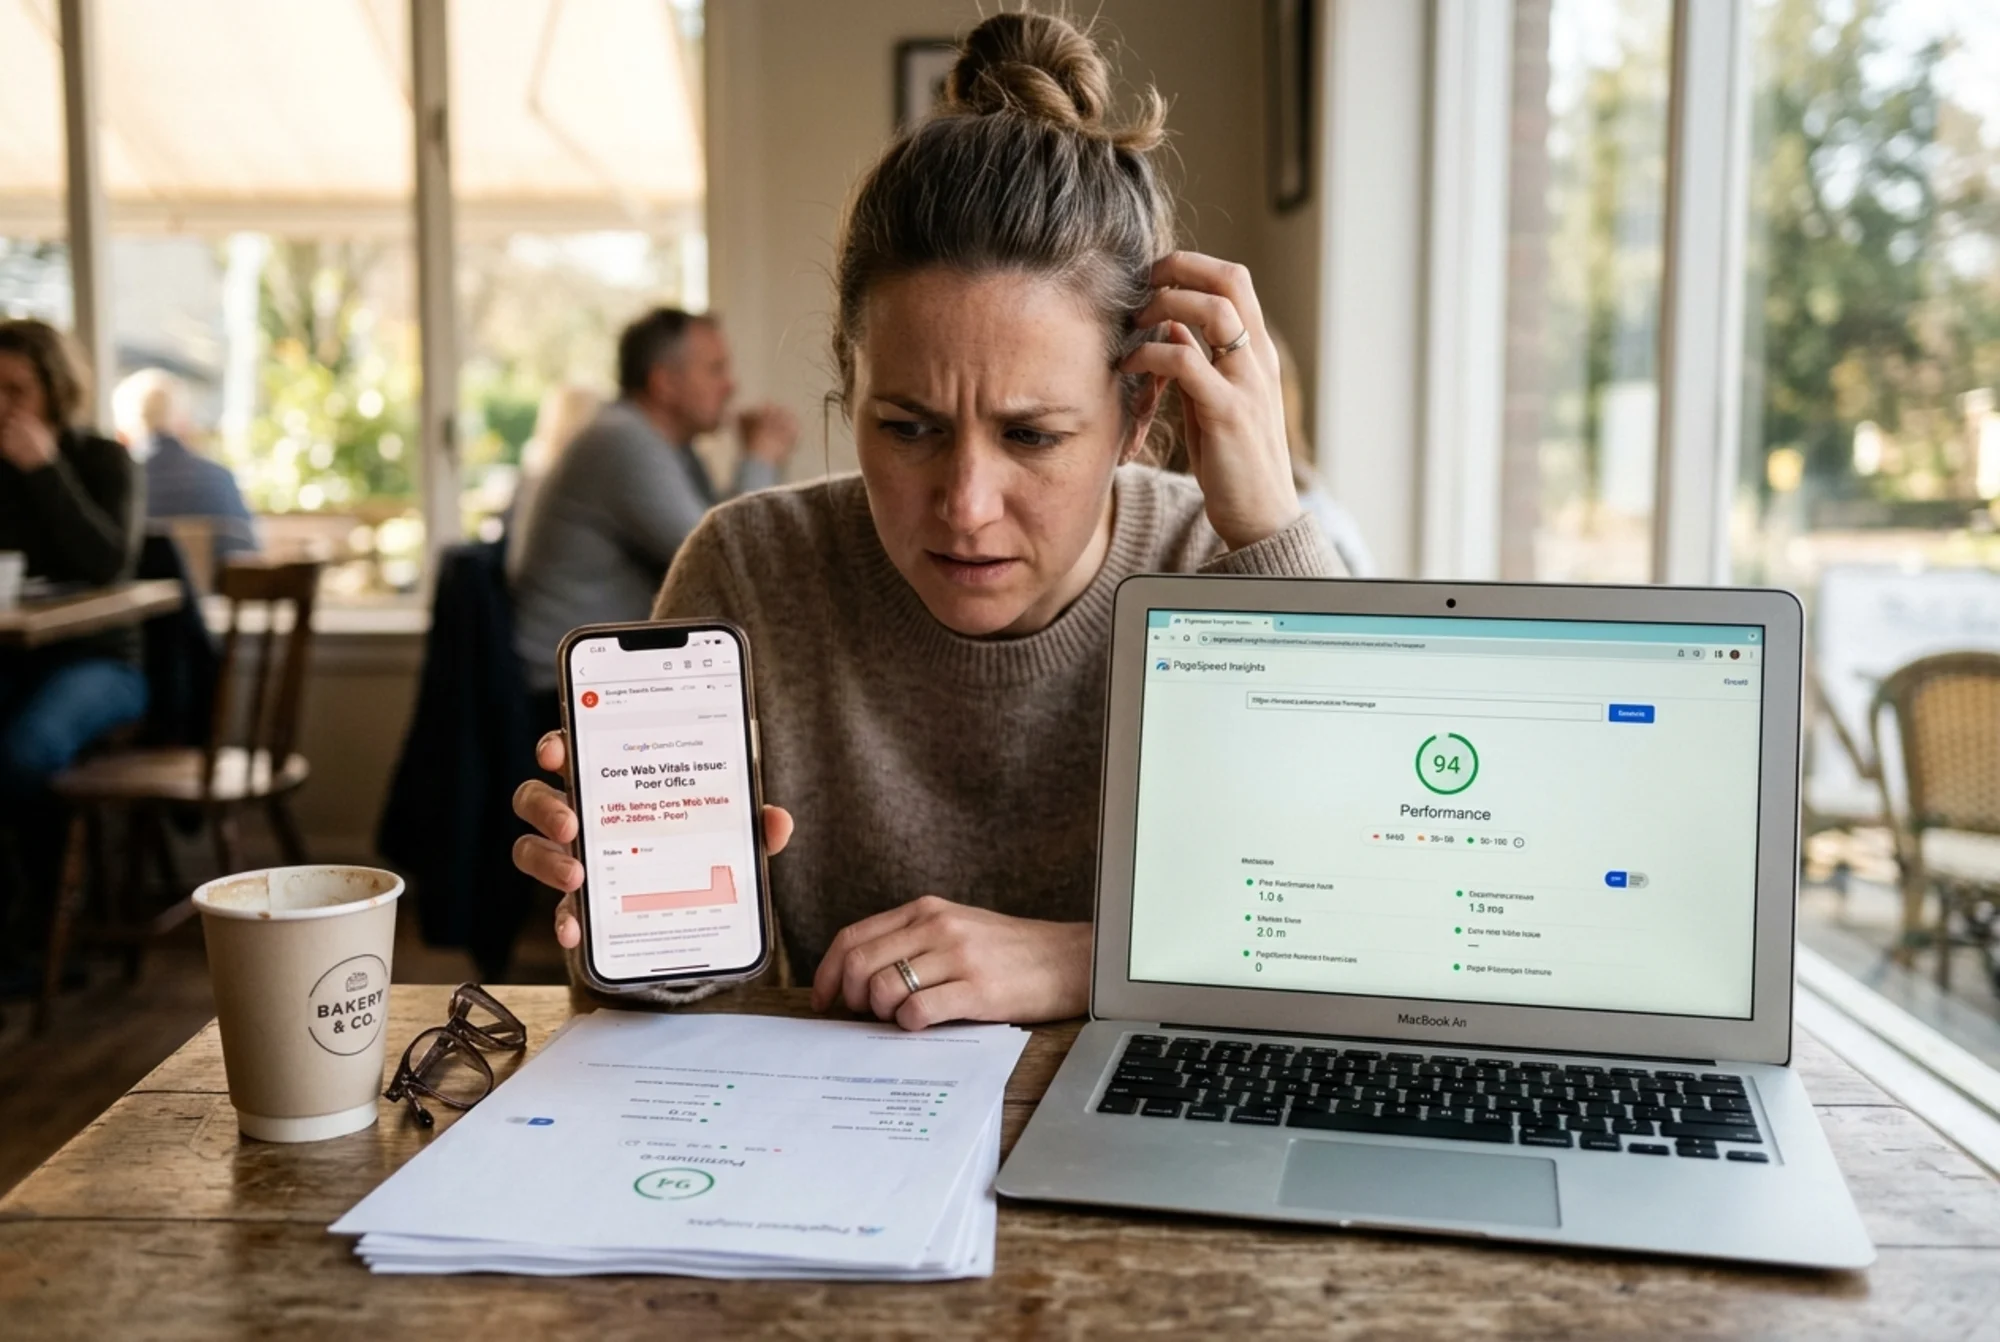
Here's what was actually happening:
- The lab test loaded her homepage from a Google data center, on a simulated mid-tier device, with a throttled but stable connection. Her hero image — a beautiful 1.8MB photo of croissants — loaded in 2.1 seconds in that environment. That's a "Good" LCP.
- Her real customers, mostly women aged 30–60 searching for "bakery near me" on their phones during their commute, were loading the same hero image on cellular networks while bouncing between cell towers. Their average LCP was 4.6 seconds. That's "Poor."
The lab said her site was fast. The field said it was slow. Both were correct. They were measuring different things.
The fix wasn't to argue with the lab score. The fix was to compress the hero image, serve it as WebP, set it as a high-priority preload, and add proper width and height attributes. Two weeks later, her field LCP dropped to 2.4 seconds and the Search Console banner cleared.
The lesson: the lab score told her there was no problem. The field data told her there was. She had to listen to the field data.
Which Score Should You Actually Care About?
For a small business owner, here's the order to look at things:
1. Field data, first and always. This is what Google uses to grade you. If your field data is green across LCP, INP, and CLS, you're fine — even if a lab test gives you a 60.
2. Lab data, second, as a diagnostic. When your field data is bad, the lab tools tell you why. They identify the unoptimized image, the render-blocking script, the layout shift. Use them as a flashlight, not as a verdict.
3. Your own test on your own phone, third. Pull up your site on your actual phone, on cellular (turn off wifi), and time it. Not statistically valid, but a useful sanity check. If it feels slow to you, it feels slow to your customers.
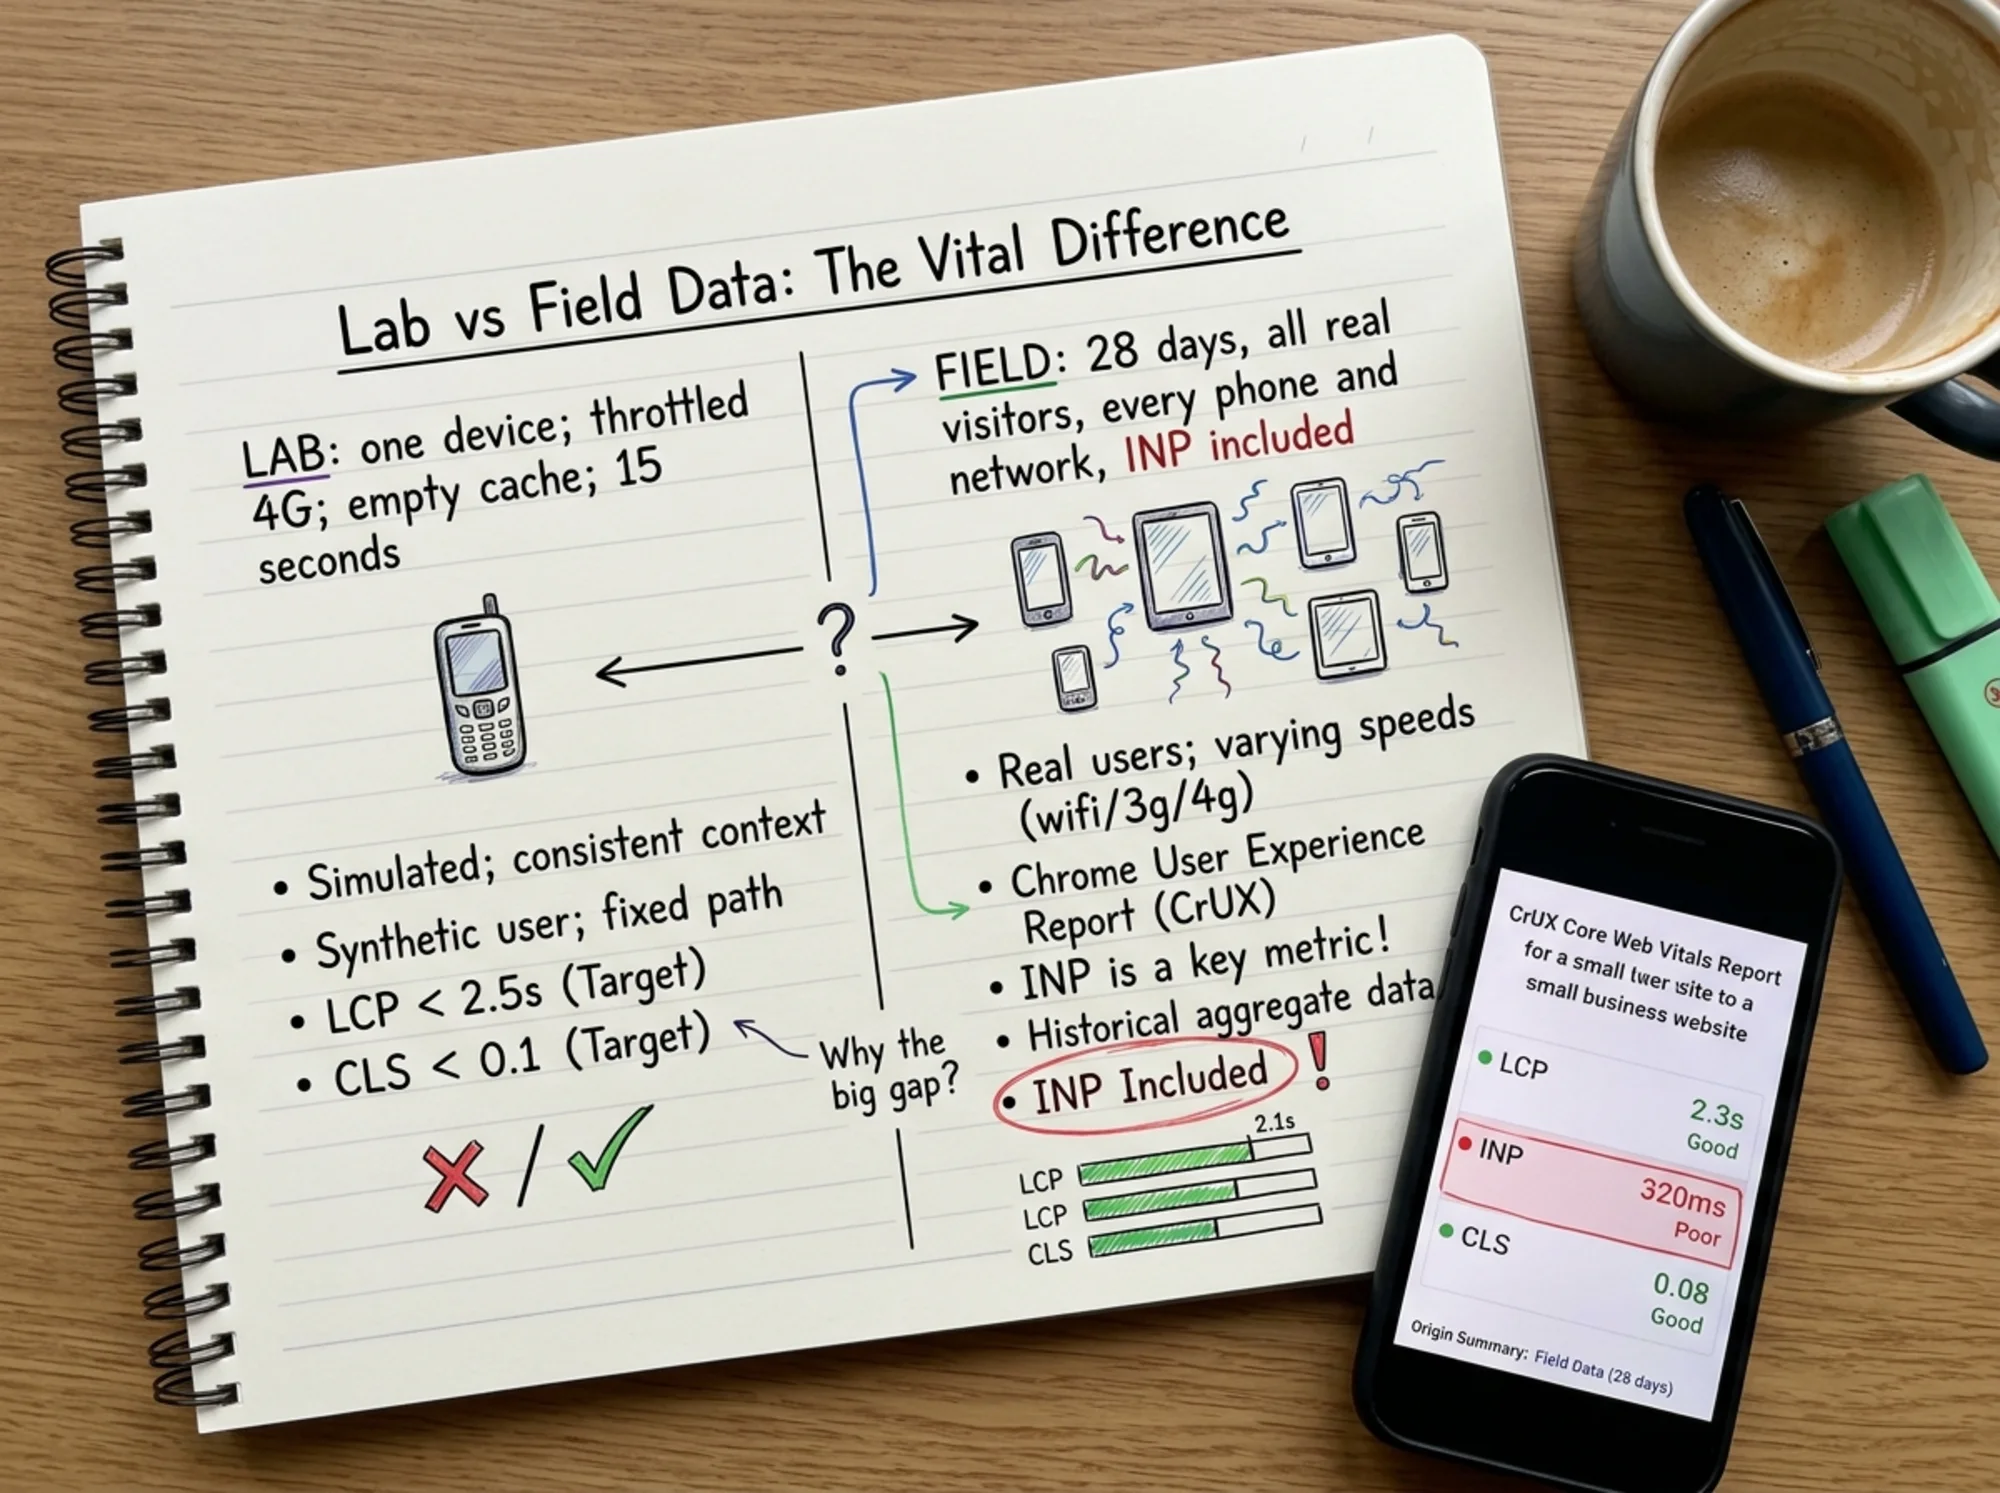
Where to Find Each Type of Data
Plain instructions, no jargon:
Field data (the score that matters):
- Google Search Console → Experience → Core Web Vitals. The field data Google is actually using to grade you, grouped by URL similarity. Mobile and desktop are listed separately.
- PageSpeed Insights → top section. The first card you see is field data from the last 28 days. If the URL doesn't have enough traffic for its own data, it falls back to "origin-level" data (your whole site averaged together).
- CrUX Dashboard (more advanced). Google's Chrome User Experience Report has a free Looker Studio dashboard that shows trends over time. Useful if you want to watch the curve, not just today's number.
Lab data (the diagnostic):
- PageSpeed Insights → bottom section. The "Diagnose performance issues" block with the big colored score circle.
- Chrome DevTools → Lighthouse tab. Right-click any page, choose Inspect, find the Lighthouse tab, run a report. Same engine, more control.
- Most third-party audit tools. Including ours — most "speed score" tools are giving you a flavor of lab data.
A useful audit tool will show both and tell you which is which. If you want a quick read on your own site without setting up Search Console, you can run a free Core Web Vitals check and get both numbers side by side.
A Mini-Checklist for Making Sense of a Disagreement
Next time your lab and field numbers disagree, walk through this in order:
- [ ] Open Search Console first. What does the actual report say? Which metric is failing — LCP, INP, or CLS?
- [ ] Check whether it's mobile, desktop, or both. Most small business problems are mobile-only. The fix is usually different.
- [ ] Look at which URL group is failing. Homepage? Product pages? A specific blog post? Don't try to fix everything; fix the group that's actually broken.
- [ ] Run PageSpeed Insights on a failing URL. Scroll past the lab score and read the field data first. Then use the lab section to find the diagnostic.
- [ ] Pick one metric to focus on. Trying to fix LCP, INP, and CLS at once leads to nothing getting fixed. Start with the worst offender.
- [ ] Re-check field data in 14–28 days. Field data updates slowly because it's averaged over 28 days. You won't see your fix instantly. Be patient.
Common Mistakes That Trip Up Small Business Owners
- Trusting a green lab score over a red field score. Trust the field.
- Panicking over one bad lab test. Lab tests have variance. Run the same test three times — you'll get three slightly different numbers. Don't make decisions on one data point.
- Optimizing the wrong page. Your homepage scores great, so you keep optimizing it. Meanwhile your product pages, which get 80% of organic traffic, are failing. Search Console will tell you which URL group actually needs work.
- Forgetting that field data lags. You shipped a fix yesterday. The field data hasn't moved. That's expected. The 28-day rolling window means it can take two to four weeks for improvements to fully show up.
- Assuming a "fast" desktop site is fast for everyone. Desktop traffic is shrinking for most small businesses. Mobile is the field that matters.
Specific Fixes by Metric
Once you know which metric is failing in your field data, target the work:
- LCP failing? Almost always the hero image, a slow server, or a render-blocking script. Start with image compression and proper sizing. See LCP fixes for a deeper walkthrough.
- CLS failing? Something is shifting after the page loads — usually an image without width/height, a late-loading font, or an ad/embed. See CLS fixes.
- INP failing? A button or interaction is slow to respond. Usually third-party scripts (chat widgets, A/B testing tools, analytics) blocking the main thread. See INP fixes.

The Bottom Line
Lab data is a controlled test. Field data is real customers. When they disagree, field data wins. It's what Google uses, it's what reflects your actual visitors, and it's the only score that affects how you show up in search results.
Treat lab tools as a flashlight in a dark room. They help you find the problem. But the verdict on whether your site is fast or slow comes from the people actually using it — and that verdict lives in your Search Console.
If you've been chasing a green lab score while ignoring a red field score, stop. Open Search Console. Look at the field data. Pick the worst metric. Fix that one thing. Wait three weeks. Check again. Then move on to the next.
That's the entire job.
Run a free Core Web Vitals audit on your site. FreeSiteAudit pulls both your lab score and your field data, flags exactly which metric is failing, and tells you the most likely cause in plain English. No signup, no credit card, results in under a minute.
Sources
- web.dev — Web Vitals: https://web.dev/articles/vitals
- Google Search Central — Page experience: https://developers.google.com/search/docs/appearance/page-experience
Related Tools
Check your website for free
Get an instant score and your top 3 critical issues in under 60 seconds.
Get Your Free Audit →