FreeSiteAudit vs Google PageSpeed Insights: What Each Tool Actually Tells You
Compare FreeSiteAudit and Google PageSpeed Insights side by side. Learn what each tool measures, where they overlap, and which fits your website best.
# FreeSiteAudit vs Google PageSpeed Insights: What Each Tool Actually Tells You
You type your website into Google PageSpeed Insights. You get a score out of 100. Maybe it's green, maybe it's red. But what does that number actually mean for your business? And is speed the only thing you should worry about?
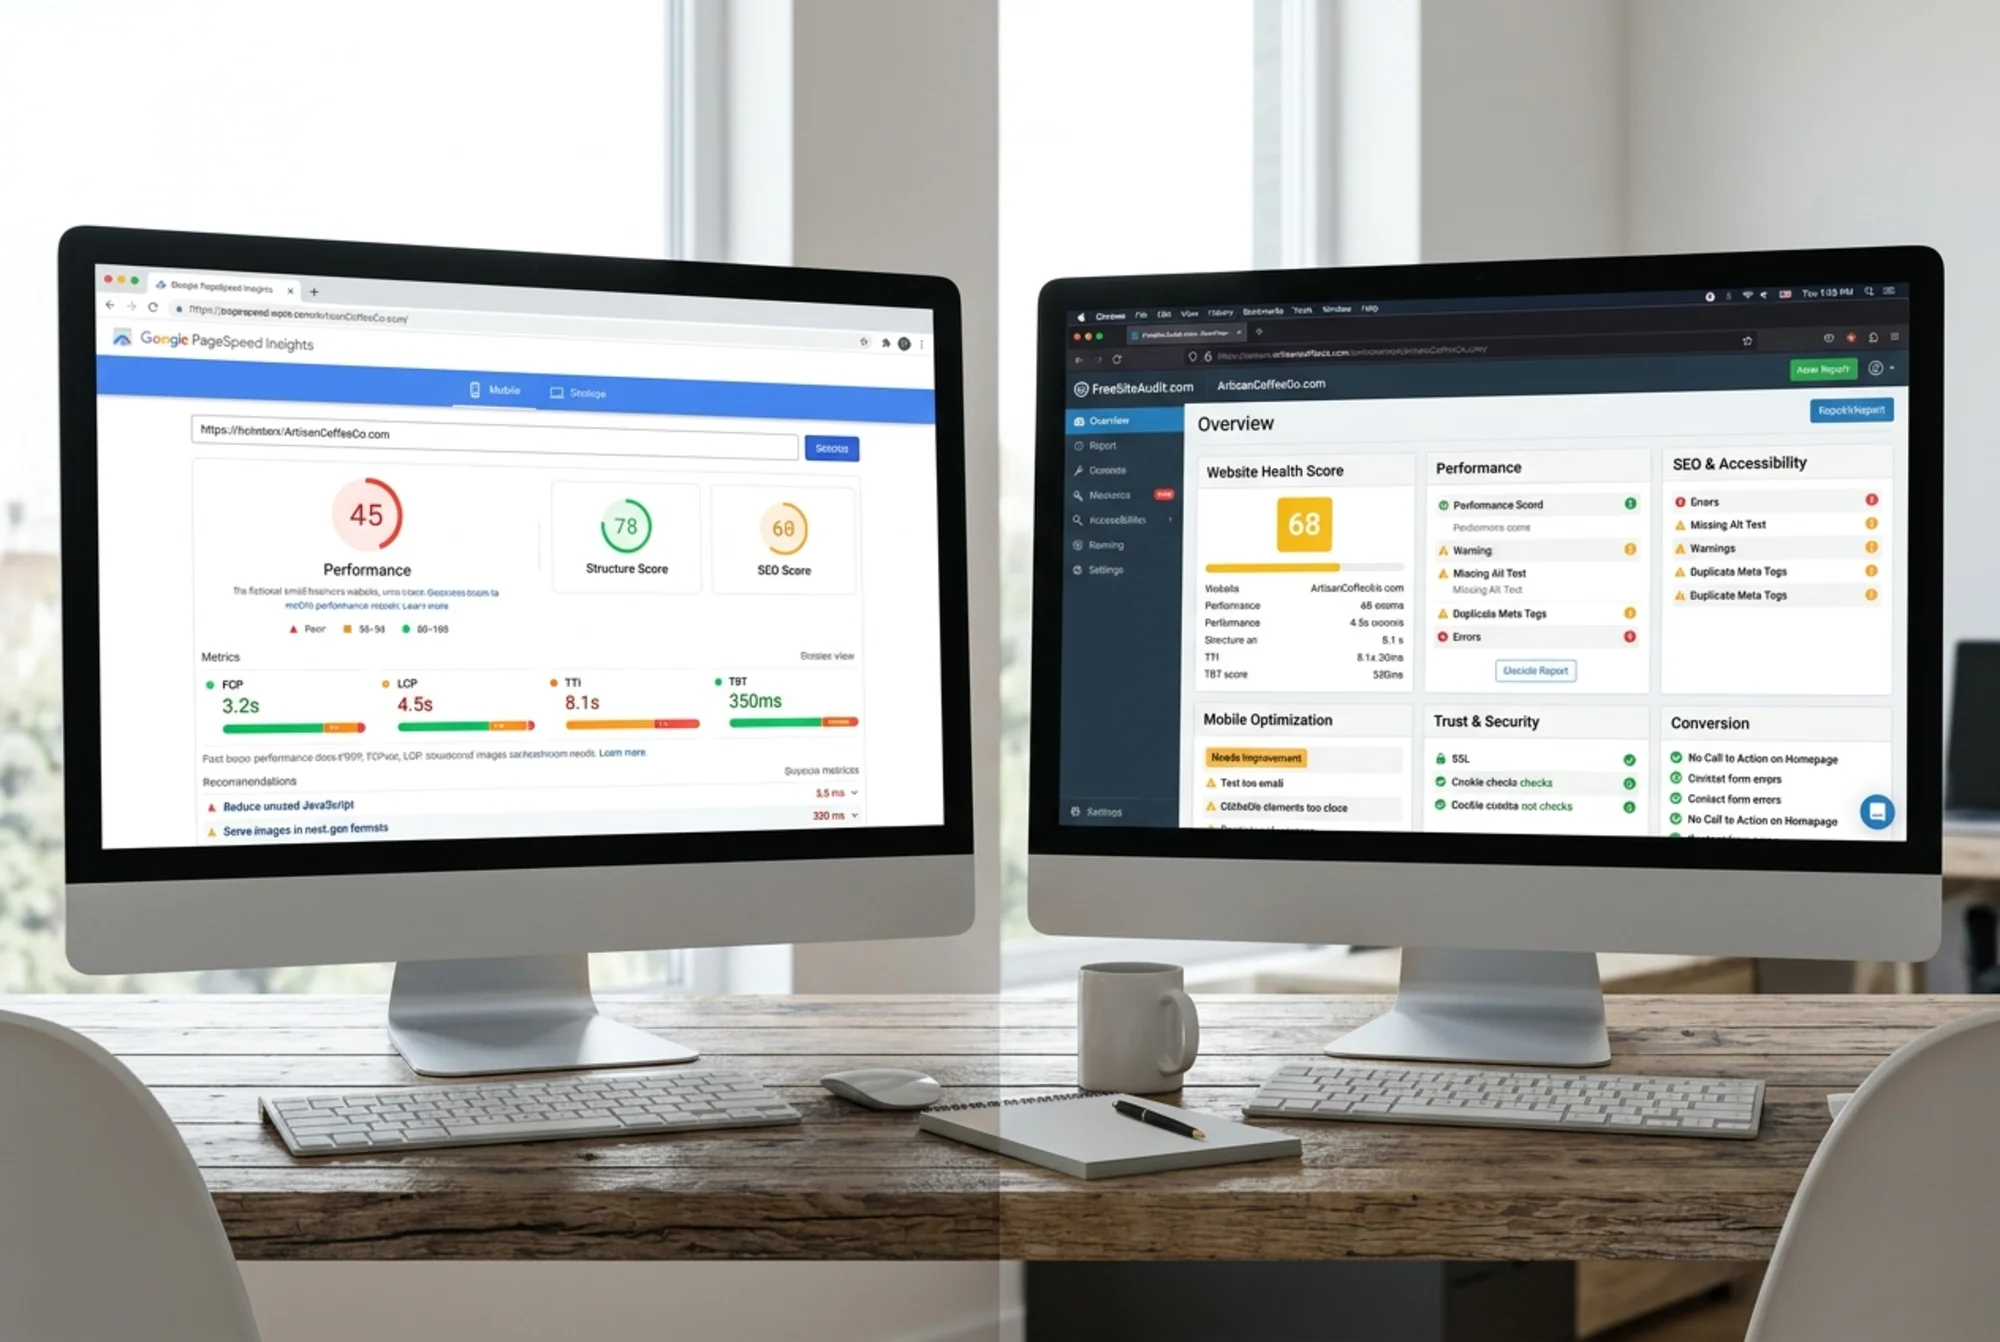
PageSpeed Insights is one of the most popular free tools on the web. It does one thing well: it measures how fast your pages load. FreeSiteAudit takes a wider view, checking speed alongside SEO basics, mobile usability, trust signals, and conversion factors.
This article breaks down what each tool actually reports, where they overlap, and how to use both without getting lost in jargon.
What Google PageSpeed Insights Measures
PageSpeed Insights (PSI) is built by Google. It runs two types of tests on any URL you enter: lab data and field data. Understanding the difference between these two is key to reading your results correctly.
Lab data comes from Lighthouse, which simulates loading your page in a controlled environment. Think of it as a test drive on a closed track. The conditions are identical every time, so you can compare changes reliably. But because the test runs on a simulated device with a fixed connection speed, it does not reflect what real visitors experience on their own phones and networks.
Field data comes from the Chrome User Experience Report (CrUX). This is real performance data collected from actual Chrome users who visited your site over the previous 28 days. It includes metrics like:
- LCP (Largest Contentful Paint): How long until the biggest visible element loads. Google considers 2.5 seconds or less to be good.
- INP (Interaction to Next Paint): How quickly the page responds when someone clicks or taps. 200 milliseconds or less is the target.
- CLS (Cumulative Layout Shift): How much the page content moves around while loading. 0.1 or less is considered stable.
- FCP (First Contentful Paint): How quickly something first appears on screen.
- TTFB (Time to First Byte): How fast the server starts responding.
These are the Core Web Vitals that Google references in its ranking documentation. They matter for search performance.

Here is a detail that trips people up: field data only shows up if enough real visitors have been tracked through Chrome. If your site is newer or gets modest traffic, PSI may fall back to origin-level data (averaging across your whole domain) or show no field data at all. That means smaller business sites often only see lab results, which represent simulated conditions rather than actual visitor experience.
PSI also reports on mobile and desktop separately. Since Google uses mobile-first indexing, the mobile results carry more weight for how Google evaluates your site. The mobile score is almost always lower than desktop because the simulated device is slower and the connection is throttled.
What FreeSiteAudit Measures
FreeSiteAudit checks speed too, but it does not stop there. It evaluates your site across the factors that affect whether visitors find you, trust you, and take action.
A FreeSiteAudit report covers:
- Speed and performance: Load times, render-blocking resources, image optimization, and hero image sizing. Similar ground to PSI, framed in plain language.
- SEO basics: Meta titles, meta descriptions, heading structure, missing alt text, and crawlability issues. These affect whether your pages show up in search results at all.
- Mobile usability: Tap target sizes, viewport configuration, and content that does not fit the screen. Google's mobile-first indexing makes this directly tied to your rankings.
- Trust and credibility: SSL status, contact information visibility, and signals that help visitors feel confident doing business with you. A solid contact page is part of this.
- Conversion factors: Calls to action, form usability, and whether the site makes it easy for visitors to take the next step.
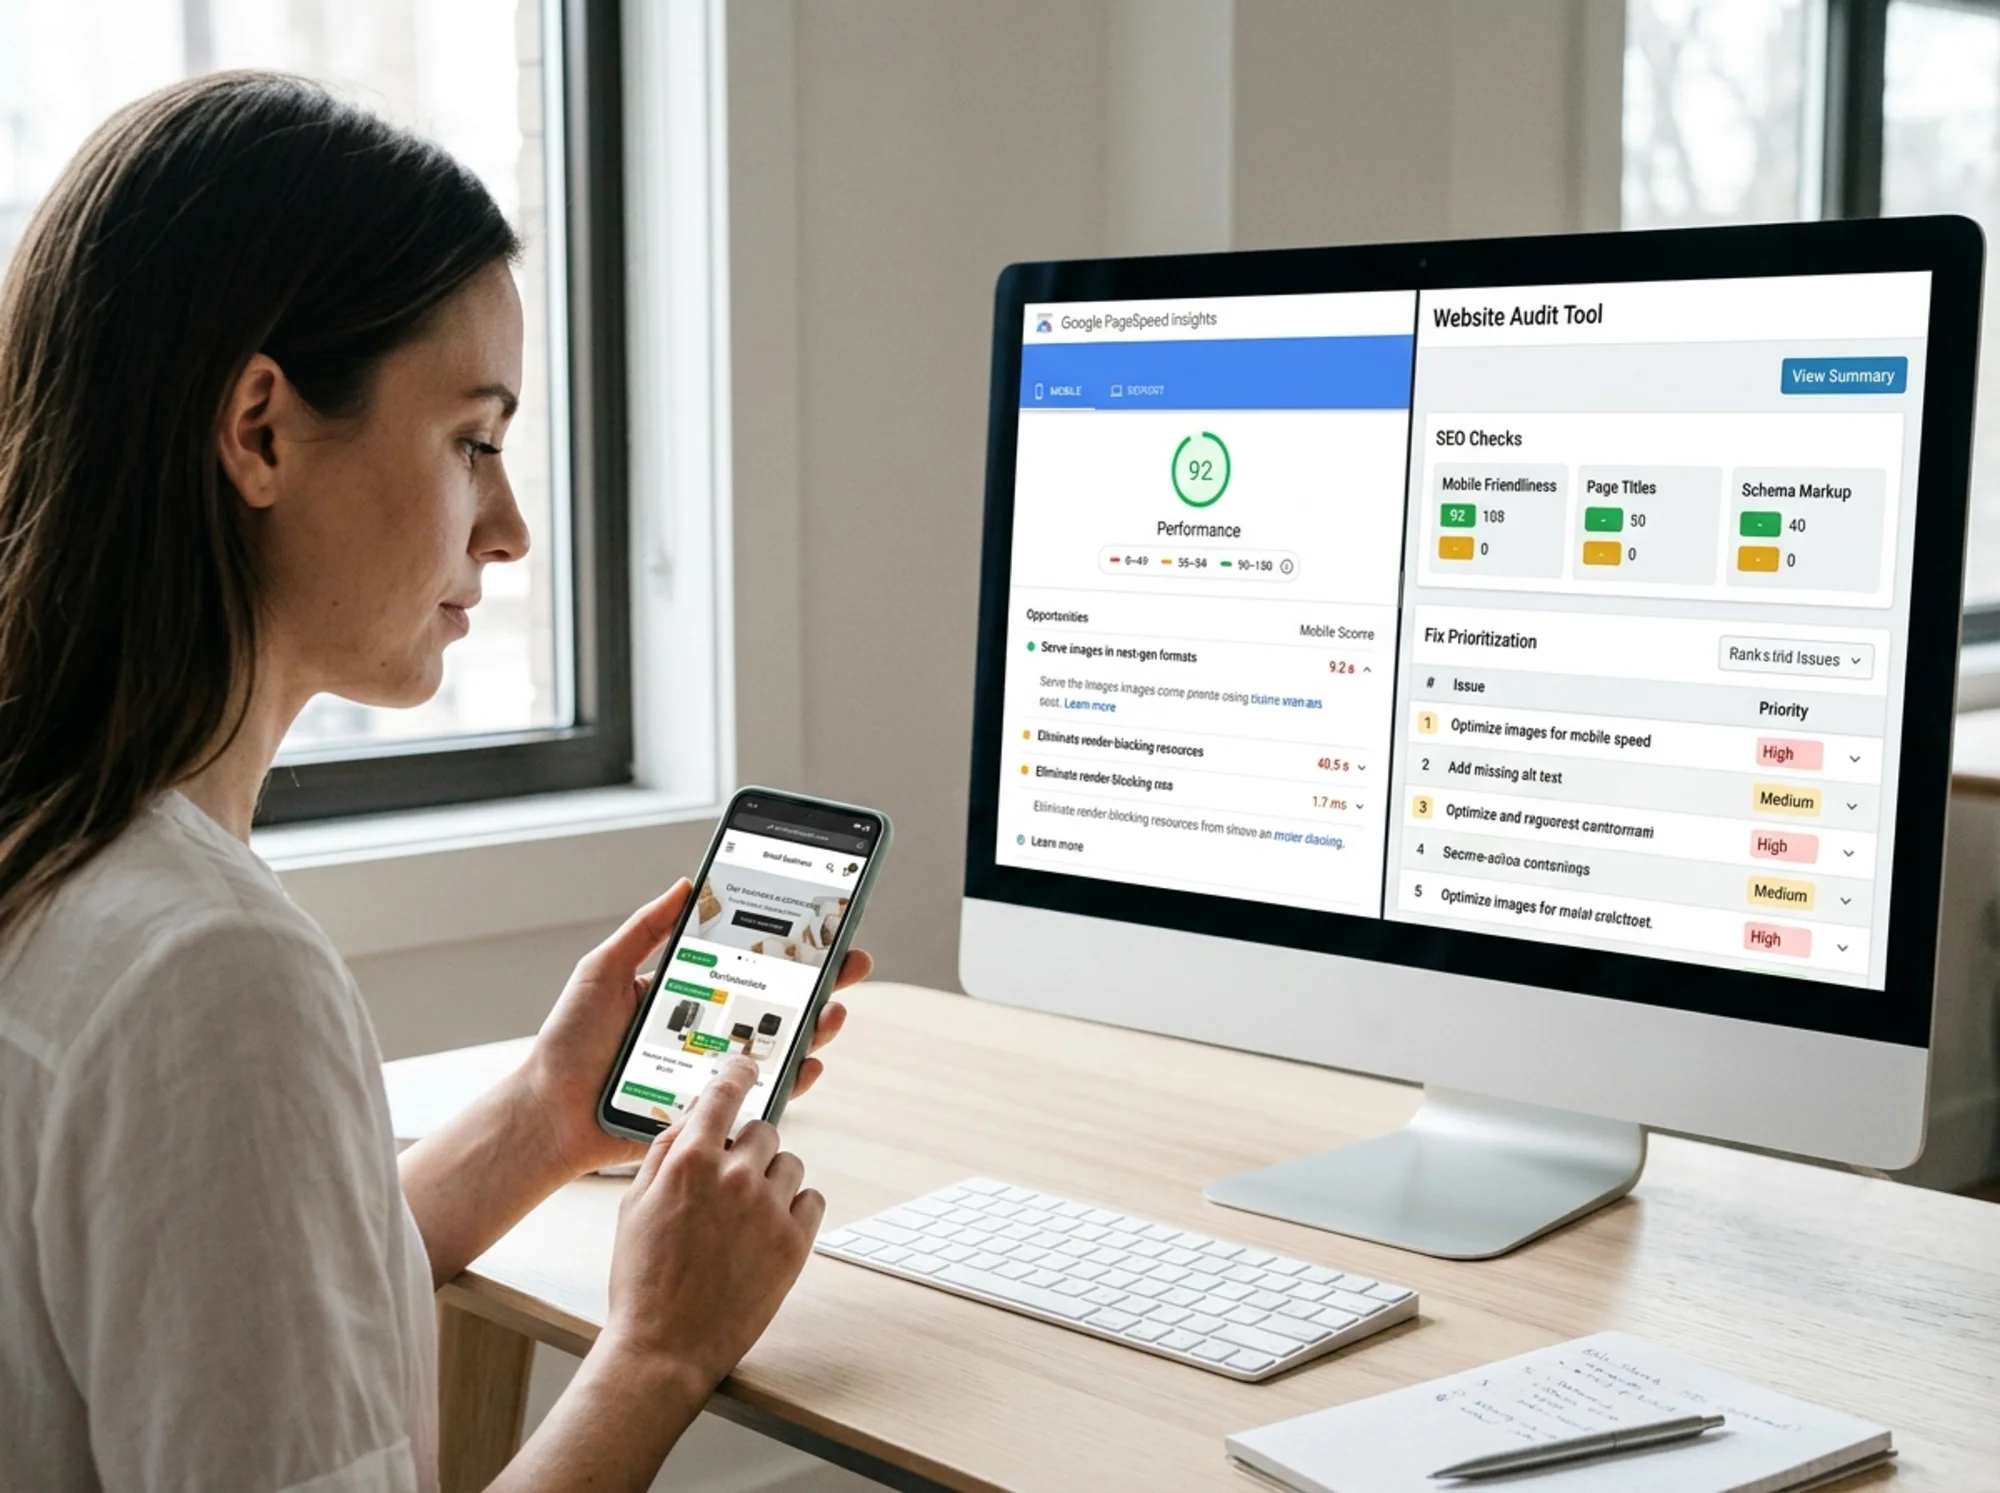
The output is a single health score with breakdowns by category, plus specific issues ranked by priority. You do not need to know what "render-blocking CSS" means technically. The report tells you what is wrong and why it matters.
Where They Overlap
Both tools care about page speed. Both will flag slow-loading pages, large images, and render-blocking resources. If your site loads slowly, both tools will tell you.
Both tools also care about mobile. PSI tests mobile performance specifically. FreeSiteAudit checks mobile usability and layout alongside performance.
If you are working on render-blocking CSS or optimizing images, either tool will show you whether your changes made a difference. PSI works well for quick before-and-after comparisons on a single page. FreeSiteAudit's speed snapshot gives you a fast performance check, while the full audit covers the bigger picture.
Where They Differ
The real difference is scope.
PSI goes deep on performance. It gives you detailed timing breakdowns, filmstrip views of the loading process, and specific Lighthouse audits for things like JavaScript execution time and text compression. If you are a developer optimizing load times, this level of detail is valuable.
But PSI does not check your meta titles. It will not tell you if your meta description is missing or too long. It will not flag that your site has no visible phone number. It will not notice that your call-to-action button is buried below the fold. It does not evaluate your contact page or your heading structure for SEO.
FreeSiteAudit catches all of those things. It trades some of PSI's performance depth for breadth across the factors that drive business results. A site that loads in 1.5 seconds but has no meta descriptions and a broken contact form is not going to rank well or convert visitors.
Another practical difference: PSI tests one URL at a time. You enter a page, you get results for that page. If you want to check your homepage, your services page, and your contact page, that is three separate tests. FreeSiteAudit runs a broader check across your site in one pass.
Understanding PSI Scores
The 0-to-100 performance score at the top of a PSI report is a weighted calculation from lab data only. It is based on metrics like FCP, LCP, and CLS, measured in a simulated environment. It does not include field data from real users.
A few things to know about this score:
It can vary between runs. Test the same URL twice and you might get 72 one time and 78 the next. This is normal and expected with simulated testing.
A score of 90 or above is considered good. 50 to 89 needs improvement. Below 50 is poor. But a "good" score only means the page loads quickly in a lab simulation. It does not mean your site is healthy overall.
The score does not account for content quality, user experience beyond loading speed, or whether your site actually converts visitors. A fast site with thin content and no clear calls to action will not grow your business.
When to Use Each Tool
Use PageSpeed Insights when:
- You want detailed performance data for a specific page
- You are working with a developer to optimize load times
- You need to track Core Web Vitals specifically
- You want to see real-user field data (if your site has enough traffic)
Use FreeSiteAudit when:
- You want a full picture of your site's health, not just speed
- You are a business owner who needs plain-language recommendations
- You want to know what to fix first based on business impact
- You need to check SEO, mobile usability, and trust signals alongside performance
- You want one report instead of running multiple tools
Use both when:
- You are doing a thorough site review before a redesign
- You want to cross-check speed findings with broader health checks
- You are building a case for website improvements and need data from multiple angles

A Practical Example
Say you run a local plumbing company. You put your homepage into PSI and get a mobile score of 62. The report says your largest image takes too long to load and some CSS is render-blocking.
That is useful. You now know your site is slower than it should be. But PSI will not tell you that your meta title is cut off in search results, your services page has no heading structure, your phone number is not visible on mobile without scrolling, or your contact form is missing a clear submit button.
FreeSiteAudit catches all of that. The speed issue shows up too, but alongside the SEO and usability problems that might matter even more for getting phone calls from local customers.
Most technical SEO fixes do not require a developer. Having a clear list of what is wrong, sorted by priority, makes it realistic to work through improvements on your own schedule.
The Bottom Line
PageSpeed Insights is a solid, free tool for understanding how fast your pages load. It is built by Google, it uses real-user data when available, and developers rely on it daily. If speed is your specific concern, it is the right starting point.
FreeSiteAudit gives you the wider view. Speed matters, but it is one piece of a healthy website. SEO, mobile usability, trust signals, and conversion setup all affect whether your site actually brings in business. Getting all of that in one report saves time and helps you prioritize what to fix first.
You do not have to pick one over the other. Use PSI when you need performance detail. Use FreeSiteAudit when you want the full picture.
Ready to see what your site looks like beyond just speed? Run a free audit with FreeSiteAudit and get a plain-English report covering performance, SEO, mobile usability, and more.
Sources
Related Tools
Check your website for free
Get an instant score and your top 3 critical issues in under 60 seconds.
Get Your Free Audit →