The Before-and-After Case Study Template That Proves Website ROI
Build a before-and-after case study that proves your website work paid off. Grab the free template with real metrics and a local business example inside.
# The Before-and-After Case Study Template That Proves Website ROI
You spent money fixing your website. Maybe you hired a developer, maybe you did it yourself over a few weekends. Either way, the question always comes up: did it actually work?
Most people cannot answer that clearly. They say things like "the site feels faster" or "I think we're getting more calls." That is not proof. That is a guess.
A before-and-after case study fixes this. It gives you real numbers, real screenshots, and a clear story you can show to clients, bosses, or yourself. It turns vague website work into something you can point to and say "here is what changed, and here is what it did for the business."
This post walks you through exactly how to build one. You will get a reusable template, a list of what to measure, and a real example from a local service business.
Why Before-and-After Case Studies Matter
There are a few reasons to build these.
For freelancers and agencies: Case studies are one of the best sales tools you can have. When a potential client asks what you can do, you show them what you already did. Numbers beat promises.
For small business owners and internal teams: A case study shows whether the work paid off and gives you something concrete to use when deciding what to fix next or what budget to approve.
The problem is most people do not collect baseline data before they start making changes. Then they cannot prove anything improved. So let us fix that.
Step 1: Collect Your Baseline Before You Touch Anything
This is the part everyone skips, and it is the most important part. Before you change a single thing on your website, record these numbers.
The Metrics That Matter
| Metric | Where to Find It | Why It Matters |
|---|---|---|
| Page load time | Speed Snapshot tool or Google PageSpeed | Directly affects bounce rate and SEO |
| Health/SEO score | Free site audit | Overall snapshot of technical health |
| Core Web Vitals (LCP, CLS, INP) | Google Search Console or PageSpeed Insights | Google uses these for ranking |
| Organic traffic | Google Analytics | Shows if search visitors are finding you |
| Bounce rate | Google Analytics | Shows if visitors stick around |
| Conversion rate | Google Analytics goals/events | Shows if visitors take action |
| Keyword rankings | Google Search Console | Shows your visibility in search |
| Missing meta descriptions | Meta Description Checker | Affects click-through rate from search |
| Trust signals present | Trust Signals scanner | Affects whether visitors convert |
You do not need all of these. Pick the ones that connect to your actual business goal. If you are a local plumber trying to get more calls, focus on organic traffic, conversion rate, and page speed. If you are an agency building a case study for a client, grab everything.
How to record your baseline:
- Run a free audit on your site and save or screenshot the results.
- Export your Google Analytics data for the past 30 days. Google's GA4 guide explains how.
- Check your Core Web Vitals scores and screenshot them.
- Note the date. This matters more than you might expect. Comparing January traffic to July traffic without noting seasonality will give you misleading results.

Step 2: Document What You Changed
Keep a simple log of every change you make. This does not need to be fancy. A bullet list works fine.
For each change, note:
- What you changed (be specific: "rewrote the homepage H1 and meta description" not "updated SEO")
- When you made the change
- Why you made it (what problem it was solving)
This log connects your results to specific actions and helps you spot which changes mattered most.
Common changes worth documenting:
- Fixed broken links or missing pages
- Added or rewrote meta descriptions that improve click-through rates
- Improved page speed (compressed images, removed unused scripts)
- Added trust signals like reviews, certifications, or security badges
- Fixed mobile layout issues
- Added schema markup (check yours here)
- Made technical SEO fixes
Step 3: Wait, Then Measure Again
Here is where patience matters. You need to wait long enough for changes to take effect.
For speed improvements: You can measure these right away. Run the same tests you ran before and compare.
For SEO and traffic changes: Wait at least 30 days. Google needs time to recrawl your site and adjust rankings. For competitive keywords, 60 to 90 days is more realistic. Google's SEO starter guide explains how indexing and ranking work.
For conversion rate changes: You need enough traffic to make the numbers meaningful. If you get 100 visitors a month, one extra conversion could be random noise. Aim for at least a full month of data at your normal traffic level.
Once enough time has passed, collect the same metrics you recorded in Step 1. Use the same tools. Run your site audit again and compare scores side by side.
Step 4: Build Your Case Study
Here is a template you can copy and fill in for a client presentation, portfolio piece, or internal report. Swap the metric rows to match your project.
Before-and-After Case Study Template
Client/Business: [Name and type of business]
Website: [URL]
Time Period: [Start date] to [End date]
Goal: [What the website work was supposed to achieve]
Baseline Metrics (Before):
- Health score: [X]
- Page load time: [X seconds]
- Core Web Vitals pass: [Yes/No]
- Monthly organic traffic: [X visitors]
- Bounce rate: [X%]
- Conversion rate: [X%]
- [Add or remove rows to fit your project]
Changes Made:
- [Specific change] / [Why: what problem it solved]
- [Specific change] / [Why: what problem it solved]
- [Specific change] / [Why: what problem it solved]
Results (After):
- Health score: [X] (change: +/- X)
- Page load time: [X seconds] (change: +/- X)
- Core Web Vitals pass: [Yes/No]
- Monthly organic traffic: [X visitors] (change: +/- X%)
- Bounce rate: [X%] (change: +/- X%)
- Conversion rate: [X%] (change: +/- X%)
Business Impact:
[One or two sentences connecting the metrics to actual business results. Example: "The 34% increase in organic traffic translated to roughly 12 additional contact form submissions per month, worth an estimated $4,500 in new revenue."]
Screenshots:
[Before and after screenshots of the audit report, PageSpeed results, or analytics dashboard]
External Factors:
[Note anything that might have influenced results: seasonal trends, ad campaigns, social media spikes, or algorithm updates during the measurement window.]
Example: Green Valley Plumbing
Here is what a completed case study looks like for a local service business.
Client: Green Valley Plumbing (residential plumbing, serves a mid-size metro area)
Website: greenvalleyplumbing.com
Time Period: January 15 to March 20
Goal: Get more calls from Google search instead of relying on paid ads.
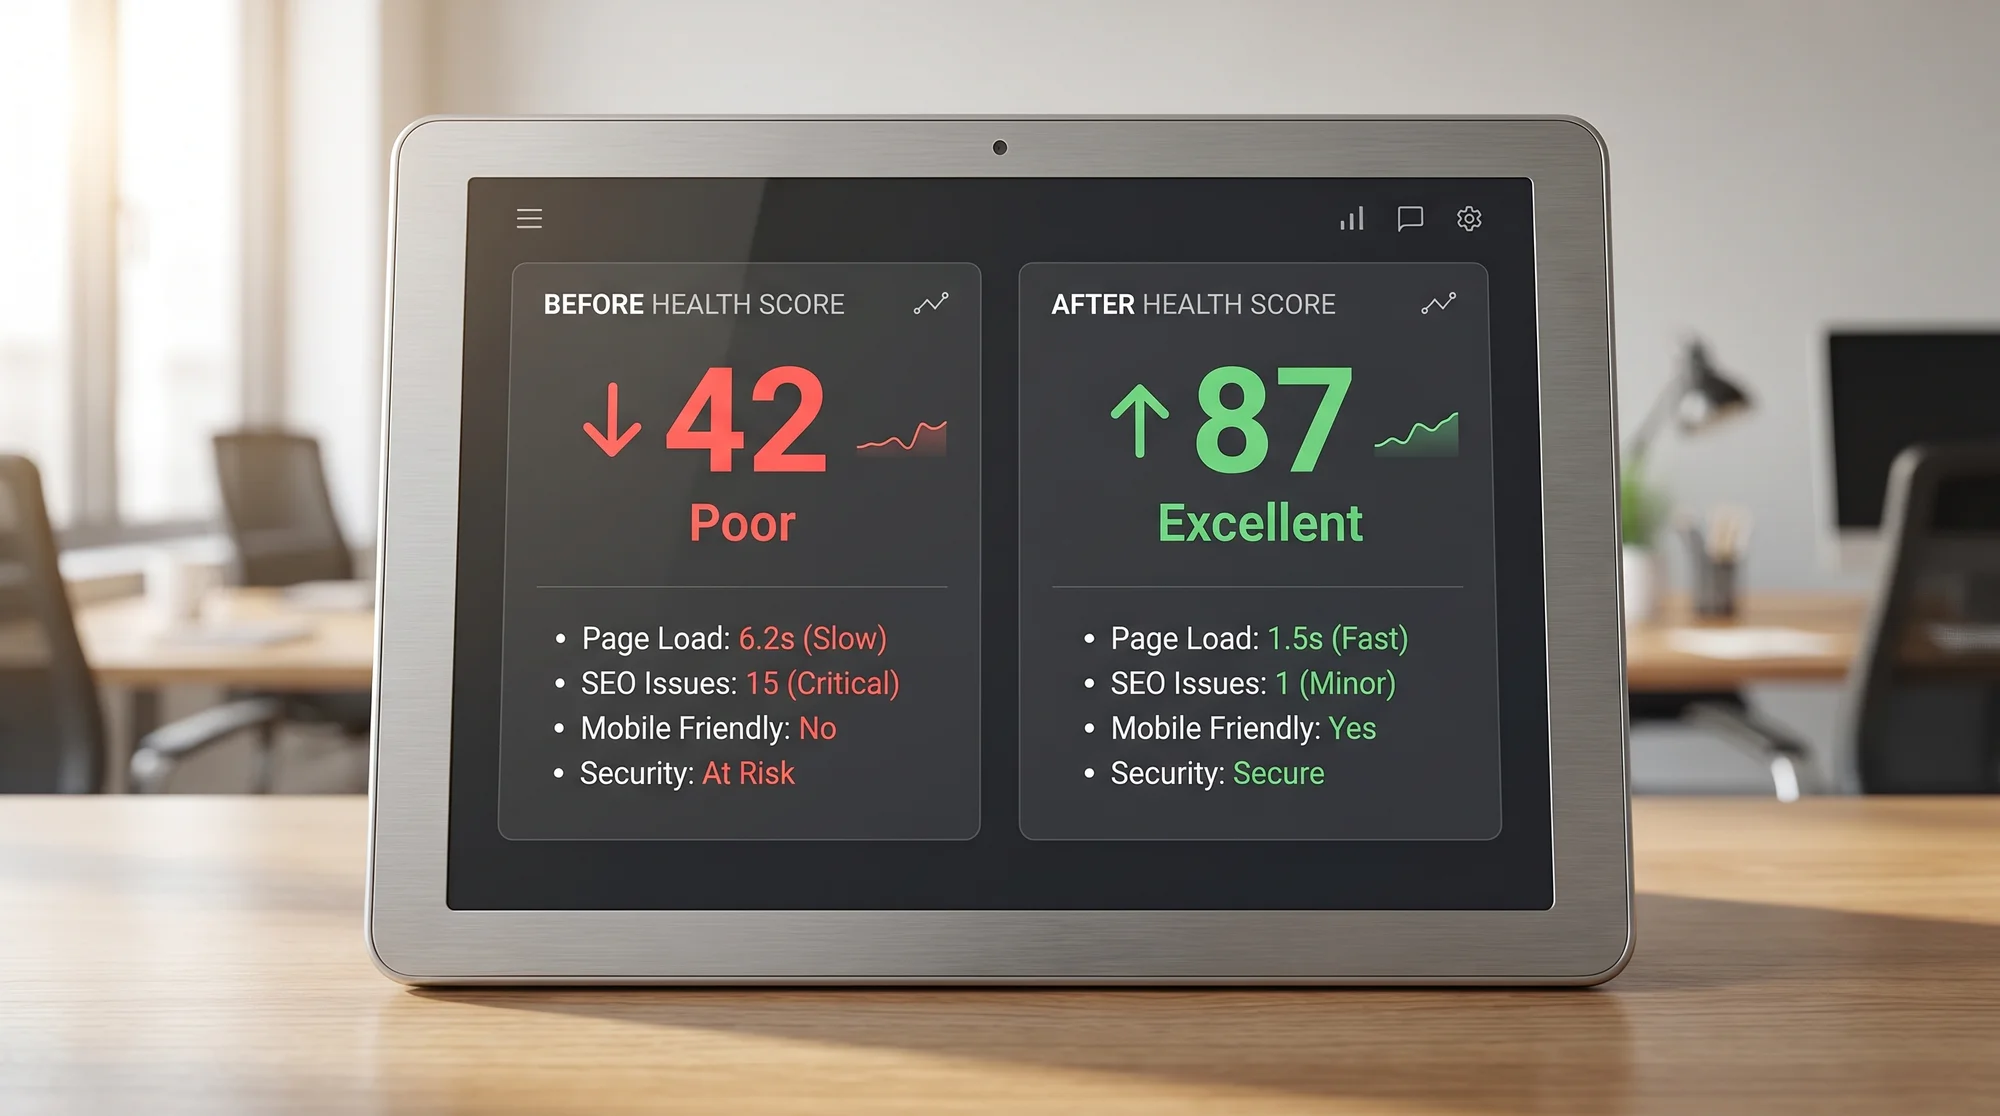
Baseline Metrics (Before):
| Metric | Before | After | Change |
|---|---|---|---|
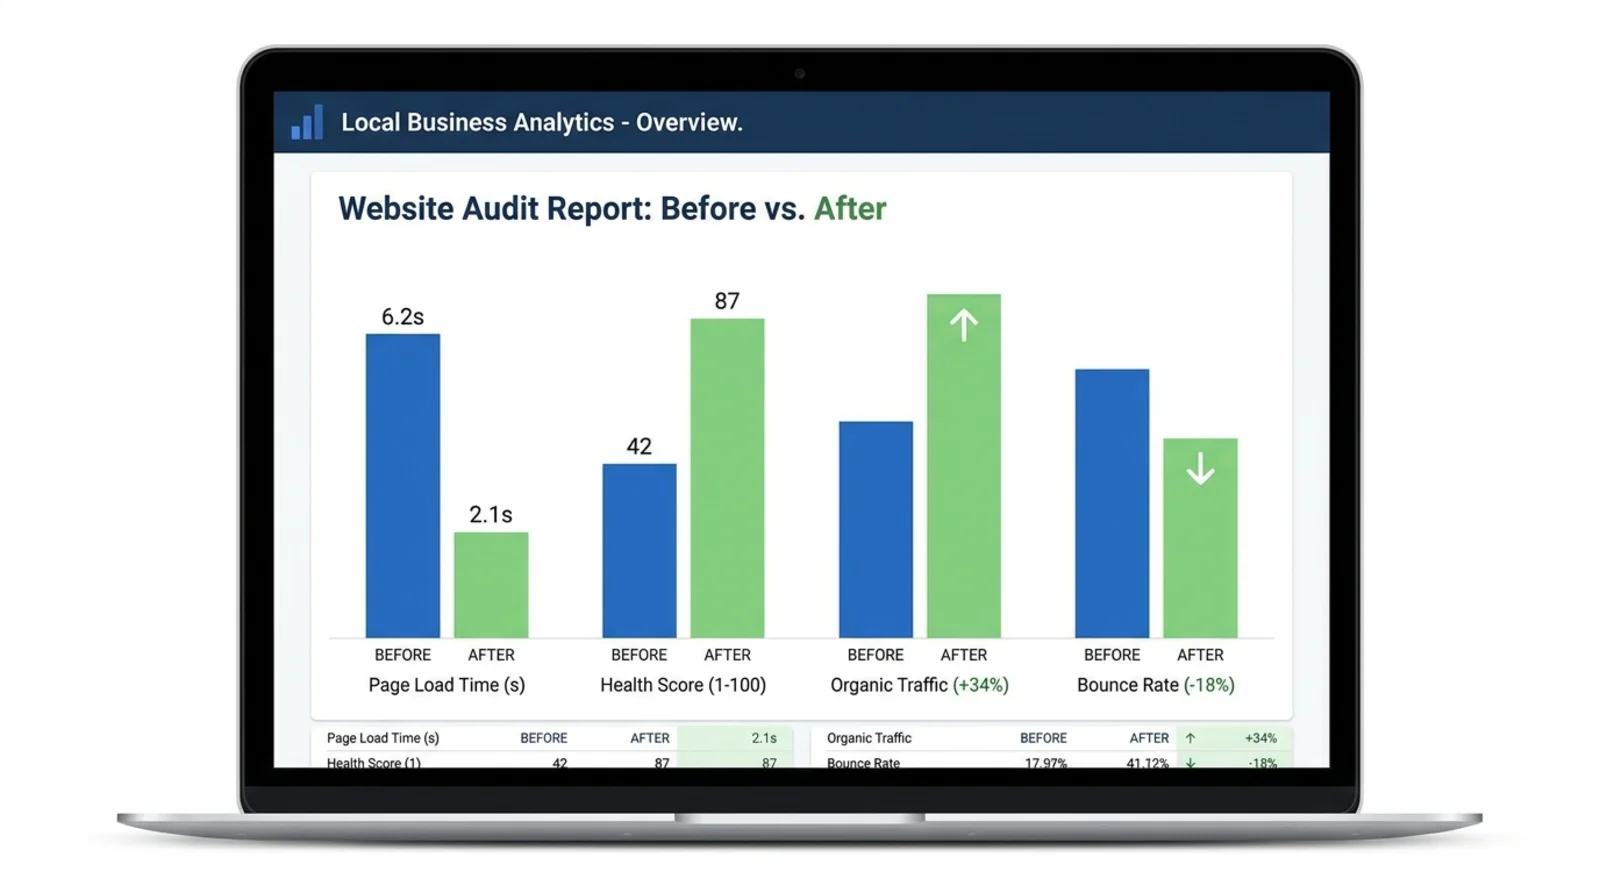
| Health score | 42 | 87 | +45 points |
| Page load time | 6.2s | 2.1s | -4.1s (66% faster) |
| Core Web Vitals | Fail | Pass | Fixed |
| Monthly organic visits | 340 | 456 | +34% |
| Bounce rate | 72% | 54% | -18 points |
| Monthly form fills | 18 | 31 | +72% |
Changes Made:
- Compressed all images and removed three unused WordPress plugins. This cut load time from 6.2 seconds to 2.1 seconds.
- Added unique meta descriptions to all 14 service pages. Previously they all shared the same generic description.
- Added schema markup for local business, service areas, and reviews.
- Added a Google reviews widget, a licensing badge, and an insurance badge to the homepage and service pages.
- Fixed 23 broken internal links found during the initial site audit.
Business Impact: Form submissions went from 18 to 31 per month. At their average job value of $380, that is roughly $4,940 in additional monthly revenue from organic search alone. Their previous monthly ad spend was $1,200, which they cut to $600.
External Factors: No major Google algorithm updates occurred during this window. Paid ad spend was reduced mid-February, so the organic traffic growth is not inflated by ad-driven visits.
This is the kind of case study you can show to the next plumbing company that asks what you can do. You can see a similar walkthrough in our dentist case study.

How to Avoid Weak or Misleading Case Studies
A bad case study is worse than no case study. Here are the mistakes to watch for.
Do not cherry-pick your time window. If traffic spiked because of a seasonal trend and not your work, that is dishonest. Always note external factors: holidays, viral social posts, ad campaigns running at the same time.
Do not use vanity metrics alone. "Impressions increased 200%" means nothing if none of those impressions turned into clicks. Always connect your metrics to business outcomes like leads, calls, or sales.
Do not compare apples to oranges. Use the same tools and the same measurement method for before and after. If you used one speed testing tool for the baseline and a different one for the results, the comparison is unreliable.
Do not skip the "what we did" section. A case study that just shows improved numbers without explaining the work is suspicious. People will wonder if the improvement happened on its own.
Do not inflate small sample sizes. If a site gets 50 visitors a month and conversions went from 1 to 3, calling that a "200% increase in conversions" is technically true but misleading. Note the actual numbers alongside percentages.
Making Case Studies a Habit
Start building the case study before your next website change.
If you are an agency or freelancer, make baseline collection a standard part of your onboarding process. Run a free audit on day one and save the results. Set a calendar reminder to re-audit after 30, 60, and 90 days.
If you are a small business owner doing your own website maintenance, build case study collection into your monthly audit routine. Even if you are not showing these to anyone else, tracking your own progress keeps you focused on changes that actually move the needle.
Keep a folder with your screenshots, exports, and notes so you can answer "is the website working?" with numbers.
The template above works for any size project. A one-page case study with real numbers will always beat a ten-page proposal full of promises. Start collecting your baseline today, do the work, and let the numbers tell the story.
Sources
Check your website for free
Get an instant score and your top 3 critical issues in under 60 seconds.
Get Your Free Audit →